The Stone Wars of Root Cause Analysis

Stone+Ripple.jpg

“As a single stone causes concentric ripples in a pond,” Martin Doyle commented on my blog post There is No Such Thing as a Root Cause, “there will always be one root cause event creating the data quality wave.  There may be interference after the root cause event which may look like a root cause, creating eddies of side effects and confusion, but I believe there will always be one root cause.  Work backwards from the data quality side effects to the root cause and the data quality ripples will be eliminated.”

Martin Doyle and I continued our congenial blog comment banter on my podcast episode The Johari Window of Data Quality, but in this blog post I wanted to focus on the stone-throwing metaphor for root cause analysis.

Let’s begin with the concept of a single stone causing the concentric ripples in a pond.  Is the stone really the root cause?  Who threw the stone?  Why did that particular person choose to throw that specific stone?  How did the stone come to be alongside the pond?  Which path did the stone-thrower take to get to the pond?  What happened to the stone-thrower earlier in the day that made them want to go to the pond, and once there, pick up a stone and throw it in the pond?

My point is that while root cause analysis is important to data quality improvement, too often we can get carried away riding the ripples of what we believe to be the root cause of poor data quality.  Adding to the complexity is the fact there’s hardly ever just one stone.  Many stones get thrown into our data ponds, and trying to un-ripple their poor quality effects can lead us to false conclusions because causation is non-linear in nature.  Causation is a complex network of many interrelated causes and effects, so some of what appear to be the effects of the root cause you have isolated may, in fact, be the effects of other causes.

As Laura Sebastian-Coleman explains, data quality assessments are often “a quest to find a single criminal—The Root Cause—rather than to understand the process that creates the data and the factors that contribute to data issues and discrepancies.”  Those approaching data quality this way, “start hunting for the one thing that will explain all the problems.  Their goal is to slay the root cause and live happily ever after.  Their intentions are good.  And slaying root causes—such as poor process design—can bring about improvement.  But many data problems are symptoms of a lack of knowledge about the data and the processes that create it.  You cannot slay a lack of knowledge.  The only way to solve a knowledge problem is to build knowledge of the data.”

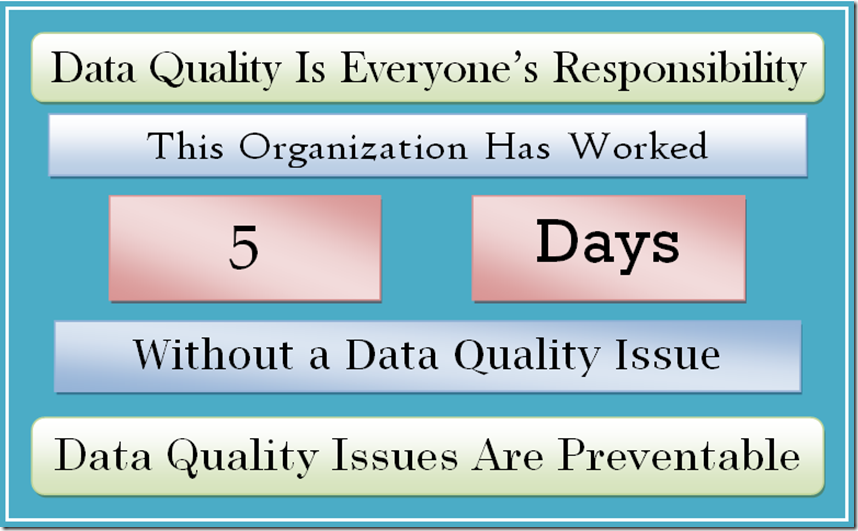
Believing that you have found and eliminated the root cause of all your data quality problems is like believing that after you have removed the stones from your pond (i.e., data cleansing), you can stop the stone-throwers by building a high stone-deflecting wall around your pond (i.e., defect prevention).  However, there will always be stones (i.e., data quality issues) and there will always be stone-throwers (i.e., people and processes) that will find a way to throw a stone in your pond.

In our recent podcast Measuring Data Quality for Ongoing Improvement, Laura Sebastian-Coleman and I discussed although root cause is used as a singular noun, just as data is used as a singular noun, we should talk about root causes since, just as data analysis is not analysis of a single datum, root cause analysis should not be viewed as analysis of a single root cause.

The bottom line, or, if you prefer, the ripple at the bottom of the pond, is the Stone Wars of Root Cause Analysis will never end because data quality is a journey, not a destination.  After all, that’s why it’s called ongoing data quality improvement.

Measuring Data Quality for Ongoing Improvement

OCDQ Radio is an audio podcast about data quality and its related disciplines, produced and hosted by Jim Harris.

Listen to Laura Sebastian-Coleman, author of the book Measuring Data Quality for Ongoing Improvement: A Data Quality Assessment Framework, and I discuss bringing together a better understanding of what is represented in data, and how it is represented, with the expectations for use in order to improve the overall quality of data.  Our discussion also includes avoiding two common mistakes made when starting a data quality project, and defining five dimensions of data quality.

Laura Sebastian-Coleman has worked on data quality in large health care data warehouses since 2003.  She has implemented data quality metrics and reporting, launched and facilitated a data quality community, contributed to data consumer training programs, and has led efforts to establish data standards and to manage metadata.  In 2009, she led a group of analysts in developing the original Data Quality Assessment Framework (DQAF), which is the basis for her book.

Laura Sebastian-Coleman has delivered papers at MIT’s Information Quality Conferences and at conferences sponsored by the International Association for Information and Data Quality (IAIDQ) and the Data Governance Organization (DGO).  She holds IQCP (Information Quality Certified Professional) designation from IAIDQ, a Certificate in Information Quality from MIT, a B.A. in English and History from Franklin & Marshall College, and a Ph.D. in English Literature from the University of Rochester.

Popular OCDQ Radio Episodes

Clicking on the link will take you to the episode’s blog post:

  • Demystifying Data Science — Guest Melinda Thielbar, a Ph.D. Statistician, discusses what a data scientist does and provides a straightforward explanation of key concepts such as signal-to-noise ratio, uncertainty, and correlation.
  • Data Quality and Big Data — Guest Tom Redman (aka the “Data Doc”) discusses Data Quality and Big Data, including if data quality matters less in larger data sets, and if statistical outliers represent business insights or data quality issues.
  • Demystifying Master Data Management — Guest John Owens explains the three types of data (Transaction, Domain, Master), the four master data entities (Party, Product, Location, Asset), and the Party-Role Relationship, which is where we find many of the terms commonly used to describe the Party master data entity (e.g., Customer, Supplier, Employee).
  • Data Governance Star Wars — Special Guests Rob Karel and Gwen Thomas joined this extended, and Star Wars themed, discussion about how to balance bureaucracy and business agility during the execution of data governance programs.
  • The Johari Window of Data Quality — Guest Martin Doyle discusses helping people better understand their data and assess its business impacts, not just the negative impacts of bad data quality, but also the positive impacts of good data quality.
  • Data Profiling Early and Often — Guest James Standen discusses data profiling concepts and practices, and how bad data is often misunderstood and can be coaxed away from the dark side if you know how to approach it.
  • Studying Data Quality — Guest Gordon Hamilton discusses the key concepts from recommended data quality books, including those which he has implemented in his career as a data quality practitioner.

Data Qualia

In philosophy (according to Wikipedia), the term qualia is used to describe the subjective quality of conscious experience.

Examples of qualia are the pain of a headache, the taste of wine, or the redness of an evening sky.  As Daniel Dennett explains:

“Qualia is an unfamiliar term for something that could not be more familiar to each of us:

The ways things seem to us.”

Like truth, beauty, and singing ability, data quality is in the eyes of the beholder, or since data quality is most commonly defined as fitness for the purpose of use, we could say that data quality is in the eyes of the user.

However, most data has both multiple uses and multiple users.  Data of sufficient quality for one use or one user may not be of sufficient quality for other uses and other users.  Quite often these diverse data needs and divergent data quality perspectives make it a daunting challenge to provide meaningful data quality metrics to the organization.

Recently on the Data Roundtable, Dylan Jones of Data Quality Pro discussed the need to create data quality reports that matter, explaining that if you’re relying on canned data profiling reports (i.e., column statistics and data quality metrics at an attribute, table, and system level), then you are measuring data quality in isolation of how the business is performing.

Instead, data quality metrics must measure data qualia—the subjective quality of the user’s business experience with data:

“Data Qualia is an unfamiliar term for something that must become more familiar to the organization:

The ways data quality impact business performance.”

Related Posts

The Point of View Paradox

DQ-BE: Single Version of the Time

Single Version of the Truth

Beyond a “Single Version of the Truth”

The Idea of Order in Data

Hell is other people’s data

DQ-BE: Data Quality Airlines

DQ-Tip: “There is no such thing as data accuracy...”

Data Quality and the Cupertino Effect

DQ-Tip: “Data quality is primarily about context not accuracy...”

Data and Process Transparency

Illustration via the SlideShare presentation: The Social Intranet

How do you know if you have poor data quality?

How do you know what your business processes and technology are doing to your data?

Waiting for poor data quality to reveal itself is like waiting until the bread pops up to see if you burnt your toast, at which point it is too late to save the bread—after all, it’s not like you can reactively cleanse the burnt toast.

Extending the analogy, let’s imagine that the business process is toasting, the technology is the toaster, and the data is the toast, which is being prepared for an end user.  (We could also imagine that the data is the bread and information is the toast.)

A more proactive approach to data quality begins with data and process transparency, which can help you monitor the quality of your data in much the same way as a transparent toaster could help you monitor your bread during the toasting process.

Performing data profiling and data quality assessments can provide insight into the quality of your data, but these efforts must include identifying the related business processes, technology, and end users of the data being analyzed.

However, the most important aspect is to openly share this preliminary analysis of the data, business, and technology landscape since it provides detailed insights about potential problems, which helps the organization better evaluate possible solutions.

Data and process transparency must also be maintained as improvement initiatives are implemented.  Regularly repeat the cycle of analysis and publication of its findings, which provides a feedback loop for tracking progress and keeping everyone informed.

The downside of transparency is that it can reveal how bad things are, but without this awareness, improvement is not possible.


Related Posts

Video: Oh, the Data You’ll Show!

Finding Data Quality

Why isn’t our data quality worse?

Days Without A Data Quality Issue

The Diffusion of Data Governance

Adventures in Data Profiling (Part 8)

Schrödinger’s Data Quality

Data Gazers

Why isn’t our data quality worse?

In psychology, the term negativity bias is used to explain how bad evokes a stronger reaction than good in the human mind.  Don’t believe that theory?  Compare receiving an insult with receiving a compliment—which one do you remember more often?

Now, this doesn’t mean the dark side of the Force is stronger, it simply means that we all have a natural tendency to focus more on the negative aspects, rather than on the positive aspects, of most situations, including data quality.

In the aftermath of poor data quality negatively impacting decision-critical enterprise information, the natural tendency is for a data quality initiative to begin by focusing on the now painfully obvious need for improvement, essentially asking the question:

Why isn’t our data quality better?

Although this type of question is a common reaction to failure, it is also indicative of the problem-seeking mindset caused by our negativity bias.  However, Chip and Dan Heath, authors of the great book Switch, explain that even in failure, there are flashes of success, and following these “bright spots” can illuminate a road map for action, encouraging a solution-seeking mindset.

“To pursue bright spots is to ask the question:

What’s working, and how can we do more of it?

Sounds simple, doesn’t it? 

Yet, in the real-world, this obvious question is almost never asked.

Instead, the question we ask is more problem focused:

What’s broken, and how do we fix it?”


Why isn’t our data quality worse?

For example, let’s pretend that a data quality assessment is performed on a data source used to make critical business decisions.  With the help of business analysts and subject matter experts, it’s verified that this critical source has an 80% data accuracy rate.

The common approach is to ask the following questions (using a problem-seeking mindset):

  • Why isn’t our data quality better?
  • What is the root cause of the 20% inaccurate data?
  • What process (business or technical, or both) is broken, and how do we fix it?
  • What people are responsible, and how do we correct their bad behavior?

But why don’t we ask the following questions (using a solution-seeking mindset):

  • Why isn’t our data quality worse?
  • What is the root cause of the 80% accurate data?
  • What process (business or technical, or both) is working, and how do we re-use it?
  • What people are responsible, and how do we encourage their good behavior?

I am not suggesting that we abandon the first set of questions, especially since there are times when a problem-seeking mindset might be a better approach (after all, it does also incorporate a solution-seeking mindset—albeit after a problem is identified).

I am simply wondering why we often never even consider asking the second set of questions?

Most data quality initiatives focus on developing new solutions—and not re-using existing solutions.

Most data quality initiatives focus on creating new best practices—and not leveraging existing best practices.

Perhaps you can be the chosen one who will bring balance to the data quality initiative by asking both questions:

Why isn’t our data quality better?  Why isn’t our data quality worse?

The Real Data Value is Business Insight

Data Values for COUNTRY Understanding your data usage is essential to improving its quality, and therefore, you must perform data analysis on a regular basis.

A data profiling tool can help you by automating some of the grunt work needed to begin your data analysis, such as generating levels of statistical summaries supported by drill-down details, including data value frequency distributions (like the ones shown to the left).

However, a common mistake is to hyper-focus on the data values.

Narrowing your focus to the values of individual fields is a mistake when it causes you to lose sight of the wider context of the data, which can cause other errors like mistaking validity for accuracy.

Understanding data usage is about analyzing its most important context—how your data is being used to make business decisions.


“Begin with the decision in mind”

In his excellent recent blog post It’s time to industrialize analytics, James Taylor wrote that “organizations need to be much more focused on directing analysts towards business problems.”  Although Taylor was writing about how, in advanced analytics (e.g., data mining, predictive analytics), “there is a tendency to let analysts explore the data, see what can be discovered,” I think this tendency is applicable to all data analysis, including less advanced analytics like data profiling and data quality assessments.

Please don’t misunderstand—Taylor and I are not saying that there is no value in data exploration, because, without question, it can definitely lead to meaningful discoveries.  And I continue to advocate that the goal of data profiling is not to find answers, but instead, to discover the right questions.

However, as Taylor explained, it is because “the only results that matter are business results” that data analysis should always “begin with the decision in mind.  Find the decisions that are going to make a difference to business results—to the metrics that drive the organization.  Then ask the analysts to look into those decisions and see what they might be able to predict that would help make better decisions.”

Once again, although Taylor is discussing predictive analytics, this cogent advice should guide all of your data analysis.


The Real Data Value is Business Insight

The Real Data Value is Business Insight

Returning to data quality assessments, which create and monitor metrics based on summary statistics provided by data profiling tools (like the ones shown in the mockup to the left), elevating what are low-level technical metrics up to the level of business relevance will often establish their correlation with business performance, but will not establish metrics that drive—or should drive—the organization.

Although built from the bottom-up by using, for the most part, the data value frequency distributions, these metrics lose sight of the top-down fact that business insight is where the real data value lies.

However, data quality metrics such as completeness, validity, accuracy, and uniqueness, which are just a few common examples, should definitely be created and monitored—unfortunately, a single straightforward metric called Business Insight doesn’t exist.

But let’s pretend that my other mockup metrics were real—50% of the data is inaccurate and there is an 11% duplicate rate.

Oh, no!  The organization must be teetering on the edge of oblivion, right?  Well, 50% accuracy does sound really bad, basically like your data’s accuracy is no better than flipping a coin.  However, which data is inaccurate, and far more important, is the inaccurate data actually being used to make a business decision?

As for the duplicate rate, I am often surprised by the visceral reaction it can trigger, such as: “how can we possibly claim to truly understand who our most valuable customers are if we have an 11% duplicate rate?”

So, would reducing your duplicate rate to only 1% automatically result in better customer insight?  Or would it simply mean that the data matching criteria was too conservative (e.g., requiring an exact match on all “critical” data fields), preventing you from discovering how many duplicate customers you have?  (Or maybe the 11% indicates the matching criteria was too aggressive).

My point is that accuracy and duplicate rates are just numbers—what determines if they are a good number or a bad number?

The fundamental question that every data quality metric you create must answer is: How does this provide business insight?

If a data quality (or any other data) metric can not answer this question, then it is meaningless.  Meaningful metrics always represent business insight because they were created by beginning with the business decisions in mind.  Otherwise, your metrics could provide the comforting, but false, impression that all is well, or you could raise red flags that are really red herrings.

Instead of beginning data analysis with the business decisions in mind, many organizations begin with only the data in mind, which results in creating and monitoring data quality metrics that provide little, if any, business insight and decision support.

Although analyzing your data values is important, you must always remember that the real data value is business insight.


Related Posts

The First Law of Data Quality

Adventures in Data Profiling

Data Quality and the Cupertino Effect

Is your data complete and accurate, but useless to your business?

The Idea of Order in Data

You Can’t Always Get the Data You Want

Red Flag or Red Herring? 

DQ-Tip: “There is no point in monitoring data quality…”

Which came first, the Data Quality Tool or the Business Need?

Selling the Business Benefits of Data Quality

Days Without A Data Quality Issue

In 1970, the United States Department of Labor created the Occupational Safety and Health Administration (OSHA).  The mission of OSHA is to prevent work-related injuries, illnesses, and deaths.  Based on statistics from 2007, since OSHA's inception, occupational deaths in the United States have been cut by 62% and workplace injuries have declined by 42%.

OSHA regularly conducts inspections to determine if organizations are in compliance with safety standards and assesses financial penalties for violations.  In order to both promote workplace safety and avoid penalties, organizations provide their employees with training on the appropriate precautions and procedures to follow in the event of an accident or an emergency.

Training programs certify new employees in safety protocols and indoctrinate them into the culture of a safety-conscious workplace.  By requiring periodic re-certification, all employees maintain awareness of their personal responsibility in both avoiding workplace accidents and responding appropriately to emergencies.

Although there has been some debate about the effectiveness of the regulations and the enforcement policies, over the years OSHA has unquestionably brought about many necessary changes, especially in the area of industrial work site safety where dangerous machinery and hazardous materials are quite common. 

Obviously, even with well-defined safety standards in place, workplace accidents will still occasionally occur.  However, these standards have helped greatly reduce both the frequency and severity of the accidents.  And most importantly, safety has become a natural part of the organization's daily work routine.


A Culture of Data Quality

Similar to indoctrinating employees into the culture of a safety-conscious workplace, more and more organizations are realizing the importance of creating and maintaining the culture of a data quality conscious workplace.  A culture of data quality is essential for effective enterprise information management.

Waiting until a serious data quality issue negatively impacts the organization before starting an enterprise data quality program is analogous to waiting until a serious workplace accident occurs before starting a safety program.

Many data quality issues are caused by a lack of data ownership and an absence of clear guidelines indicating who is responsible for ensuring that data is of sufficient quality to meet the daily business needs of the enterprise.  In order for data quality to be taken seriously within your organization, everyone first needs to know that data quality is an enterprise-wide priority.

Additionally, data quality standards must be well-defined, and everyone must accept their personal responsibility in both preventing data quality issues and responding appropriately to mitigate the associated business risks when issues do occur.


Data Quality Assessments

The data equivalent of a safety inspection is a data quality assessment, which provides a much needed reality check for the perceptions and assumptions that the enterprise has about the quality of its data. 

Performing a data quality assessment helps with a wide variety of tasks including: verifying data matches the metadata that describes it, preparing meaningful questions for subject matter experts, understanding how data is being used, quantifying the business impacts of poor quality data, and evaluating the ROI of data quality improvements.

An initial assessment provides a baseline and helps establish data quality standards as well as set realistic goals for improvement.  Subsequent data quality assessments, which should be performed on a regular basis, will track your overall progress.

Although preventing data quality issues is your ultimate goal, don't let the pursuit of perfection undermine your efforts.  Always be mindful of the data quality issues that remain unresolved, but let them serve as motivation.  Learn from your mistakes without focusing on your failures – focus instead on making steady progress toward improving your data quality.


Data Governance

The data equivalent of verifying compliance with safety standards is data governance, which establishes policies and procedures to align people throughout the organization.  Enterprise data quality programs require a data governance framework in order successfully deploy data quality as an enterprise-wide initiative. 

By facilitating the collaboration of all business and technical stakeholders, aligning data usage with business metrics, enforcing data ownership, and prioritizing data quality, data governance enables effective enterprise information management.

Obviously, even with well-defined and well-managed data governance policies and procedures in place, data quality issues will still occasionally occur.  However, your goal is to greatly reduce both the frequency and severity of your data quality issues. 

And most importantly, the responsibility for ensuring that data is of sufficient quality to meet your daily business needs, has now become a natural part of your organization's daily work routine.


Days Without A Data Quality Issue

Organizations commonly display a sign indicating how long they have gone without a workplace accident.  Proving that I certainly did not miss my calling as a graphic designer, I created this “sign” for Days Without A Data Quality Issue:

Days Without A Data Quality Issue


Related Posts

Poor Data Quality is a Virus

DQ-Tip: “Don't pass bad data on to the next person...”

The Only Thing Necessary for Poor Data Quality

Hyperactive Data Quality (Second Edition)

Data Governance and Data Quality

Getting Your Data Freq On

One of the most basic features of a data profiling tool is the ability to generate statistical summaries and frequency distributions for the unique values and formats found within the fields of your data sources. 

Data profiling is often performed during a data quality assessment and involves much more than reviewing the output generated by a data profiling tool and a data quality assessment obviously involves much more than just data profiling. 

However, in this post I want to focus on some of the benefits of using a data profiling tool.


Freq'ing Awesome Analysis

Data profiling can help you perform essential analysis such as:

  • Verifying data matches the metadata that describes it
  • Identifying missing values
  • Identifying potential default values
  • Identifying potential invalid values
  • Checking data formats for inconsistencies
  • Preparing meaningful questions to ask subject matter experts

Data profiling can also help you with many of the other aspects of domain, structural and relational integrity, as well as determining functional dependencies, identifying redundant storage and other important data architecture considerations.


How can a data profiling tool help you?  Let me count the ways

Data profiling tools provide counts and percentages for each field that summarize its content characteristics such as:

  • NULL count of the number of records with a NULL value
  • Missing count of the number of records with a missing value (i.e. non-NULL absence of data e.g. character spaces)
  • Actual count of the number of records with an actual value (i.e. non-NULL and non-missing)
  • Completeness percentage calculated as Actual divided by the total number of records
  • Cardinality count of the number of distinct actual values
  • Uniqueness percentage calculated as Cardinality divided by the total number of records
  • Distinctness percentage calculated as Cardinality divided by Actual

The absence of data can be represented many different ways with NULL being most common for relational database columns.  However, character fields can contain all spaces or an empty string and numeric fields can contain all zeroes.  Consistently representing the absence of data is a common data quality standard. 

Completeness and uniqueness are particularly useful in evaluating potential key fields and especially a single primary key, which should be both 100% complete and 100% unique.  Required non-key fields may often be 100% complete but a low cardinality could indicate the presence of potential default values.

Distinctness can be useful in evaluating the potential for duplicate records.  For example, a Tax ID field may be less than 100% complete (i.e. not every record has one) and therefore also less than 100% unique (i.e. it can not be considered a potential single primary key because it can not be used to uniquely identify every record).  If the Tax ID field is also less than 100% distinct (i.e. some distinct actual values occur on more than one record), then this could indicate the presence of potential duplicate records.

Data profiling tools will often generate many other useful summary statistics for each field including: minimum/maximum values, minimum/maximum field sizes, and the number of data types (based on analyzing the values, not the metadata).


Show Me the Value (or the Format)

A frequency distribution of the unique formats found in a field is sometimes more useful than the unique values.

A frequency distribution of unique values is useful for:

  • Fields with an extremely low cardinality (i.e. indicating potential default values)
  • Fields with a relatively low cardinality (e.g. gender code and source system code)
  • Fields with a relatively small number of valid values (e.g. state abbreviation and country code)

A frequency distribution of unique formats is useful for:

  • Fields expected to contain a single data type and/or length (e.g. integer surrogate key or ZIP+4 add-on code)
  • Fields with a relatively limited number of valid formats (e.g. telephone number and birth date)
  • Fields with free-form values and a high cardinality  (e.g. customer name and postal address)

Cardinality can play a major role in deciding whether or not you want to be shown values or formats since it is much easier to review all of the values when there are not very many of them.  Alternatively, the review of high cardinality fields can also be limited to the most frequently occurring values.

Some fields can also be alternatively analyzed using partial values (e.g. birth year extracted from birth date) or a combination of values and formats (e.g. account numbers expected to have a valid alpha prefix followed by all numbers). 

Free-form fields (e.g. personal name) are often easier to analyze as formats constructed by parsing and classifying the individual values within the field (e.g. salutation, given name, family name, title).


Conclusion

Understanding your data is essential to using it effectively and improving its quality.  In order to achieve these goals, there is simply no substitute for data analysis.

A data profiling tool can help you by automating some of the grunt work needed to begin this analysis.  However, it is important to remember that the analysis itself can not be automated you need to review the statistical summaries and frequency distributions generated by the data profiling tool and more importantly translate your analysis into meaningful reports and questions to share with the rest of the project team.  Well performed data profiling is a highly interactive and iterative process.

Data profiling is typically one of the first tasks performed on a data quality project.  This is especially true when data is made available before business requirements are documented and subject matter experts are available to discuss usage, relevancy, standards and the metrics for measuring and improving data quality.  All of which are necessary to progress from profiling your data to performing a full data quality assessment.  However, these are not acceptable excuses for delaying data profiling.


Therefore, grab your favorite caffeinated beverage, settle into your most comfortable chair, roll up your sleeves and...

Get your data freq on! 


Related Posts

Adventures in Data Profiling (Part 1)

Adventures in Data Profiling (Part 2)

Adventures in Data Profiling (Part 3)

Adventures in Data Profiling (Part 4)

Adventures in Data Profiling (Part 5)

Adventures in Data Profiling (Part 6)

Adventures in Data Profiling (Part 7)

Schrödinger's Data Quality

Data Gazers

Data Governance and Data Quality

Regular readers know that I often blog about the common mistakes I have observed (and made) in my professional services and application development experience in data quality (for example, see my post: The Nine Circles of Data Quality Hell).

According to Wikipedia: “Data governance is an emerging discipline with an evolving definition.  The discipline embodies a convergence of data quality, data management, business process management, and risk management surrounding the handling of data in an organization.”

Since I have never formally used the term “data governance” with my clients, I have been researching what data governance is and how it specifically relates to data quality.

Thankfully, I found a great resource in Steve Sarsfield's excellent book The Data Governance Imperative, where he explains:

“Data governance is about changing the hearts and minds of your company to see the value of information quality...data governance is a set of processes that ensures that important data assets are formally managed throughout the enterprise...at the root of the problems with managing your data are data quality problems...data governance guarantees that data can be trusted...putting people in charge of fixing and preventing issues with data...to have fewer negative events as a result of poor data.”

Although the book covers data governance more comprehensively, I focused on three of my favorite data quality themes:

  • Business-IT Collaboration
  • Data Quality Assessments
  • People Power


Business-IT Collaboration

Data governance establishes policies and procedures to align people throughout the organization.  Successful data quality initiatives require the Business and IT to forge an ongoing and iterative collaboration.  Neither the Business nor IT alone has all of the necessary knowledge and resources required to achieve data quality success.  The Business usually owns the data and understands its meaning and use in the day-to-day operation of the enterprise and must partner with IT in defining the necessary data quality standards and processes. 

Steve Sarsfield explains:

“Business users need to understand that data quality is everyone's job and not just an issue with technology...the mantra of data governance is that technologists and business users must work together to define what good data is...constantly leverage both business users, who know the value of the data, and technologists, who can apply what the business users know to the data.” 

Data Quality Assessments

Data quality assessments provide a much needed reality check for the perceptions and assumptions that the enterprise has about the quality of its data.  Data quality assessments help with many tasks including verifying metadata, preparing meaningful questions for subject matter experts, understanding how data is being used, and most importantly – evaluating the ROI of data quality improvements.  Building data quality monitoring functionality into the applications that support business processes provides the ability to measure the effect that poor data quality can have on decision-critical information.

Steve Sarsfield explains:

“In order to know if you're winning in the fight against poor data quality, you have to keep score...use data quality scorecards to understand the detail about quality of data...and aggregate those scores into business value metrics...solid metrics...give you a baseline against which you can measure improvement over time.” 

People Power

Although incredible advancements continue, technology alone cannot provide the solution.  Data governance and data quality both require a holistic approach involving people, process and technology.  However, by far the most important of the three is people.  In my experience, it is always the people involved that make projects successful.

Steve Sarsfield explains:

“The most important aspect of implementing data governance is that people power must be used to improve the processes within an organization.  Technology will have its place, but it's most importantly the people who set up new processes who make the biggest impact.”

Conclusion

Data governance provides the framework for evolving data quality from a project to an enterprise-wide initiative.  By facilitating the collaboration of business and technical stakeholders, aligning data usage with business metrics, and enabling people to be responsible for data ownership and data quality, data governance provides for the ongoing management of the decision-critical information that drives the tactical and strategic initiatives essential to the enterprise's mission to survive and thrive in today's highly competitive and rapidly evolving marketplace.


Related Posts

TDWI World Conference Chicago 2009

Not So Strange Case of Dr. Technology and Mr. Business

Schrödinger's Data Quality

The Three Musketeers of Data Quality


Additional Resources

Over on Data Quality Pro, read the following posts:

From the IAIDQ publications portal, read the 2008 industry report: The State of Information and Data Governance

Read Steve Sarsfield's book: The Data Governance Imperative and read his blog: Data Governance and Data Quality Insider

The Nine Circles of Data Quality Hell

“Abandon all hope, ye who enter here.” 

In Dante’s Inferno, these words are inscribed above the entrance into hell.  The Roman poet Virgil was Dante’s guide through its nine circles, each an allegory for unrepentant sins beyond forgiveness.

The Very Model of a Modern DQ General will be your guide on this journey through nine of the most common mistakes that can doom your data quality project:


1. Thinking data quality is an IT issue (or a business issue) - Data quality is not an IT issue.  Data quality is also not a business issue.  Data quality is everyone's issue.  Successful data quality projects are driven by an executive management mandate for the business and IT to forge an ongoing and iterative collaboration throughout the entire project.  The business usually owns the data and understands its meaning and use in the day to day operation of the enterprise and must partner with IT in defining the necessary data quality standards and processes.


2. Waiting for poor data quality to affect you - Data quality projects are often launched in the aftermath of an event when poor data quality negatively impacted decision-critical enterprise information.  Some examples include a customer service nightmare, a regulatory compliance failure or a financial reporting scandal.  Whatever the triggering event, a common response is data quality suddenly becomes prioritized as a critical issue.


3. Believing technology alone is the solution - Although incredible advancements continue, technology alone cannot provide the solution.  Data quality requires a holistic approach involving people, process and technology.  Your project can only be successful when people take on the challenge united by collaboration, guided by an effective methodology, and of course, implemented with amazing technology.


4. Listening only to the expert - An expert can be an invaluable member of the data quality project team.  However, sometimes an expert can dominate the decision making process.  The expert's perspective needs to be combined with the diversity of the entire project team in order for success to be possible.


5. Losing focus on the data - The complexity of your data quality project can sometimes work against your best intentions.  It is easy to get pulled into the mechanics of documenting the business requirements and functional specifications and then charging ahead with application development.  Once the project achieves some momentum, it can take on a life of its own and the focus becomes more and more about making progress against the tasks in the project plan, and less and less on the project's actual goal, which is to improve the quality of your data.

  • This common mistake was the theme of my post: Data Gazers.


6. Chasing perfection - An obsessive-compulsive quest to find and fix every data quality problem is a laudable pursuit but ultimately a self-defeating cause.  Data quality problems can be very insidious and even the best data quality process will still produce exceptions.  Although this is easy to accept in theory, it is notoriously difficult to accept in practice.  Do not let the pursuit of perfection undermine your data quality project.


7. Viewing your data quality assessment as a one-time event - Your data quality project should begin with a data quality assessment to assist with aligning perception with reality and to get the project off to a good start by providing a clear direction and a working definition of success.  However, the data quality assessment is not a one-time event that ends when development begins.  You should perform iterative data quality assessments throughout the entire development lifecycle.


8. Forgetting about the people - People, process and technology.  All three are necessary for success on your data quality project.  However, I have found that the easiest one to forget about (and by far the most important of the three) is people.


9. Assuming if you build it, data quality will come - There are many important considerations when planning a data quality project.  One of the most important is to realize that data quality problems cannot be permanently “fixed" by implementing a one-time "solution" that doesn't require ongoing improvements.


Knowing these common mistakes is no guarantee that your data quality project couldn't still find itself lost in a dark wood.

However, knowledge could help you realize when you have strayed from the right road and light a path to find your way back.

Schrödinger's Data Quality

In 1935, Austrian physicist Erwin Schrödinger described a now famous thought experiment where:

  “A cat, a flask containing poison, a tiny bit of radioactive substance and a Geiger counter are placed into a sealed box for one hour.  If the Geiger counter doesn't detect radiation, then nothing happens and the cat lives.  However if radiation is detected, then the flask is shattered, releasing the poison which kills the cat.  According to the Copenhagen interpretation of quantum mechanics, until the box is opened, the cat is simultaneously alive and dead.  Yet, once you open the box, the cat will either be alive or dead, not a mixture of alive and dead.” 

This was only a thought experiment.  Therefore, no actual cat was harmed. 

This paradox of quantum physics, known as Schrödinger's Cat, poses the question:

  “When does a quantum system stop existing as a mixture of states and become one or the other?”


Unfortunately, data quality projects are not thought experiments.  They are complex, time consuming and expensive enterprise initiatives.  Typically, a data quality tool is purchased, expert consultants are hired to supplement staffing, production data is copied to a development server and the project begins.  Until it is completed and the new system goes live, the project is a potential success or failure.  Yet, once the new system starts being used, the project will become either a success or failure.

This paradox, which I refer to as Schrödinger's Data Quality, poses the question:

  “When does a data quality project stop existing as potential success or failure and become one or the other?”


Data quality projects should begin with the parallel and complementary efforts of drafting the business requirements while also performing a data quality assessment, which can help you:

  • Verify data matches the metadata that describes it
  • Identify potential missing, invalid and default values
  • Prepare meaningful questions for subject matter experts
  • Understand how data is being used
  • Prioritize critical data errors
  • Evaluate potential ROI of data quality improvements
  • Define data quality standards
  • Reveal undocumented business rules
  • Review and refine the business requirements
  • Provide realistic estimates for development, testing and implementation

Therefore, the data quality assessment assists with aligning perception with reality and gets the project off to a good start by providing a clear direction and a working definition of success.


However, a common mistake is to view the data quality assessment as a one-time event that ends when development begins. 


Projects should perform iterative data quality assessments throughout the entire development lifecycle, which can help you:

  • Gain a data-centric view of the project's overall progress
  • Build data quality monitoring functionality into the new system
  • Promote data-driven development
  • Enable more effective unit testing
  • Perform impact analysis on requested enhancements (i.e. scope creep)
  • Record regression cases for testing modifications
  • Identify data exceptions that require suspension for manual review and correction
  • Facilitate early feedback from the user community
  • Correct problems that could undermine user acceptance
  • Increase user confidence that the new system will meet their needs


If you wait until the end of the project to learn if you have succeeded or failed, then you treat data quality like a game of chance.

And to paraphrase Albert Einstein:

  “Do not play dice with data quality.”


Data Gazers

The Matrix Within cubicles randomly dispersed throughout the sprawling office space of companies large and small, there exist countless unsung heroes of enterprise information initiatives.  Although their job titles might be labeling them as a Business Analyst, Programmer Analyst, Account Specialist or Application Developer, their true vocation is a far more noble calling.


They are Data Gazers.


In his excellent book Data Quality Assessment, Arkady Maydanchik explains that:

"Data gazing involves looking at the data and trying to reconstruct a story behind these data.  Following the real story helps identify parameters about what might or might not have happened and how to design data quality rules to verify these parameters.  Data gazing mostly uses deduction and common sense."

All enterprise information initiatives are complex endeavors and data quality projects are certainly no exception.  Success requires people taking on the challenge united by collaboration, guided by an effective methodology, and implementing a solution using powerful technology.

But the complexity of the project can sometimes work against your best intentions.  It is easy to get pulled into the mechanics of documenting the business requirements and functional specifications and then charging ahead on the common mantra:

"We planned the work, now we work the plan." 

Once the project achieves some momentum, it can take on a life of its own and the focus becomes more and more about making progress against the tasks in the project plan, and less and less on the project's actual goal...improving the quality of the data. 

In fact, I have often observed the bizarre phenomenon where as a project "progresses" it tends to get further and further away from the people who use the data on a daily basis.


However, Arkady Maydanchik explains that:

"Nobody knows the data better than the users.  Unknown to the big bosses, the people in the trenches are measuring data quality every day.  And while they rarely can give a comprehensive picture, each one of them has encountered certain data problems and developed standard routines to look for them.  Talking to the users never fails to yield otherwise unknown data quality rules with many data errors."

There is a general tendency to consider that working directly with the users and the data during application development can only be disruptive to the project's progress.  There can be a quiet comfort and joy in simply developing off of documentation and letting the interaction with the users and the data wait until the project plan indicates that user acceptance testing begins. 

The project team can convince themselves that the documented business requirements and functional specifications are suitable surrogates for the direct knowledge of the data that users possess.  It is easy to believe that these documents tell you what the data is and what the rules are for improving the quality of the data.

Therefore, although ignoring the users and the data until user acceptance testing begins may be a good way to keep a data quality project on schedule, you will only be delaying the project's inevitable failure because as all data gazers know and as my mentor Morpheus taught me:

"Unfortunately, no one can be told what the Data is. You have to see it for yourself."


TDWI World Conference Chicago 2009

Founded in 1995, TDWI (The Data Warehousing Institute™) is the premier educational institute for business intelligence and data warehousing that provides education, training, certification, news, and research for executives and information technology professionals worldwide.  TDWI conferences always offer a variety of full-day and half-day courses taught in an objective, vendor-neutral manner.  The courses taught are designed for professionals and taught by in-the-trenches practitioners who are well known in the industry.


TDWI World Conference Chicago 2009 was held May 3-8 in Chicago, Illinois at the Hyatt Regency Hotel and was a tremendous success.  I attended as a Data Quality Journalist for the International Association for Information and Data Quality (IAIDQ).

I used Twitter to provide live reporting from the conference.  Here are my notes from the courses I attended: 


BI from Both Sides: Aligning Business and IT

Jill Dyché, CBIP, is a partner and co-founder of Baseline Consulting, a management and technology consulting firm that provides data integration and business analytics services.  Jill is responsible for delivering industry and client advisory services, is a frequent lecturer and writer on the business value of IT, and writes the excellent Inside the Biz blog.  She is the author of acclaimed books on the business value of information: e-Data: Turning Data Into Information With Data Warehousing and The CRM Handbook: A Business Guide to Customer Relationship Management.  Her latest book, written with Evan Levy, is Customer Data Integration: Reaching a Single Version of the Truth.

Course Quotes from Jill Dyché:

  • Five Critical Success Factors for Business Intelligence (BI):
    1. Organization - Build organizational structures and skills to foster a sustainable program
    2. Processes - Align both business and IT development processes that facilitate delivery of ongoing business value
    3. Technology - Select and build technologies that deploy information cost-effectively
    4. Strategy - Align information solutions to the company's strategic goals and objectives
    5. Information - Treat data as an asset by separating data management from technology implementation
  • Three Different Requirement Categories:
    1. What is the business need, pain, or problem?  What business questions do we need to answer?
    2. What data is necessary to answer those business questions?
    3. How do we need to use the resulting information to answer those business questions?
  • “Data warehouses are used to make business decisions based on data – so data quality is critical”
  • “Even companies with mature enterprise data warehouses still have data silos - each business area has its own data mart”
  • “Instead of pushing a business intelligence tool, just try to get people to start using data”
  • “Deliver a usable system that is valuable to the business and not just a big box full of data”


TDWI Data Governance Summit

Philip Russom is the Senior Manager of Research and Services at TDWI, where he oversees many of TDWI’s research-oriented publications, services, and events.  Prior to joining TDWI in 2005, he was an industry analyst covering BI at Forrester Research, as well as a contributing editor with Intelligent Enterprise and Information Management (formerly DM Review) magazines.

Summit Quotes from Philip Russom:

  • “Data Governance usually boils down to some form of control for data and its usage”
  • “Four Ps of Data Governance: People, Policies, Procedures, Process”
  • “Three Pillars of Data Governance: Compliance, Business Transformation, Business Integration”
  • “Two Foundations of Data Governance: Business Initiatives and Data Management Practices”
  • “Cross-functional collaboration is a requirement for successful Data Governance”


Becky Briggs, CBIP, CMQ/OE, is a Senior Manager and Data Steward for Airlines Reporting Corporation (ARC) and has 25 years of experience in data processing and IT - the last 9 in data warehousing and BI.  She leads the program team responsible for product, project, and quality management, business line performance management, and data governance/stewardship.

Summit Quotes from Becky Briggs:

  • “Data Governance is the act of managing the organization's data assets in a way that promotes business value, integrity, usability, security and consistency across the company”
  • Five Steps of Data Governance:
    1. Determine what data is required
    2. Evaluate potential data sources (internal and external)
    3. Perform data profiling and analysis on data sources
    4. Data Services - Definition, modeling, mapping, quality, integration, monitoring
    5. Data Stewardship - Classification, access requirements, archiving guidelines
  • “You must realize and accept that Data Governance is a program and not just a project”


Barbara Shelby is a Senior Software Engineer for IBM with over 25 years of experience holding positions of technical specialist, consultant, and line management.  Her global management and leadership positions encompassed network authentication, authorization application development, corporate business systems data architecture, and database development.

Summit Quotes from Barbara Shelby:

  • Four Common Barriers to Data Governance:
    1. Information - Existence of information silos and inconsistent data meanings
    2. Organization - Lack of end-to-end data ownership and organization cultural challenges
    3. Skill - Difficulty shifting resources from operational to transformational initiatives
    4. Technology - Business data locked in large applications and slow deployment of new technology
  • Four Key Decision Making Bodies for Data Governance:
    1. Enterprise Integration Team - Oversees the execution of CIO funded cross enterprise initiatives
    2. Integrated Enterprise Assessment - Responsible for the success of transformational initiatives
    3. Integrated Portfolio Management Team - Responsible for making ongoing business investment decisions
    4. Unit Architecture Review - Responsible for the IT architecture compliance of business unit solutions


Lee Doss is a Senior IT Architect for IBM with over 25 years of information technology experience.  He has a patent for process of aligning strategic capability for business transformation and he has held various positions including strategy, design, development, and customer support for IBM networking software products.

Summit Quotes from Lee Doss:

  • Five Data Governance Best Practices:
    1. Create a sense of urgency that the organization can rally around
    2. Start small, grow fast...pick a few visible areas to set an example
    3. Sunset legacy systems (application, data, tools) as new ones are deployed
    4. Recognize the importance of organization culture…this will make or break you
    5. Always, always, always – Listen to your customers


Kevin Kramer is a Senior Vice President and Director of Enterprise Sales for UMB Bank and is responsible for development of sales strategy, sales tool development, and implementation of enterprise-wide sales initiatives.

Summit Quotes from Kevin Kramer:

  • “Without Data Governance, multiple sources of customer information can produce multiple versions of the truth”
  • “Data Governance helps break down organizational silos and shares customer data as an enterprise asset”
  • “Data Governance provides a roadmap that translates into best practices throughout the entire enterprise”


Kanon Cozad is a Senior Vice President and Director of Application Development for UMB Bank and is responsible for overall technical architecture strategy and oversees information integration activities.

Summit Quotes from Kanon Cozad:

  • “Data Governance identifies business process priorities and then translates them into enabling technology”
  • “Data Governance provides direction and Data Stewardship puts direction into action”
  • “Data Stewardship identifies and prioritizes applications and data for consolidation and improvement”


Jill Dyché, CBIP, is a partner and co-founder of Baseline Consulting, a management and technology consulting firm that provides data integration and business analytics services.  (For Jill's complete bio, please see above).

Summit Quotes from Jill Dyché:

  • “The hard part of Data Governance is the data
  • “No data will be formally sanctioned unless it meets a business need”
  • “Data Governance focuses on policies and strategic alignment”
  • “Data Management focuses on translating defined polices into executable actions”
  • “Entrench Data Governance in the development environment”
  • “Everything is customer data – even product and financial data”


Data Quality Assessment - Practical Skills

Arkady Maydanchik is a co-founder of Data Quality Group, a recognized practitioner, author, and educator in the field of data quality and information integration.  Arkady's data quality methodology and breakthrough ARKISTRA technology were used to provide services to numerous organizations.  Arkady is the author of the excellent book Data Quality Assessment, a frequent speaker at various conferences and seminars, and a contributor to many journals and online publications.  Data quality curriculum by Arkady Maydanchik can be found at eLearningCurve.

Course Quotes from Arkady Maydanchik:

  • “Nothing is worse for data quality than desperately trying to fix it during the last few weeks of an ETL project”
  • “Quality of data after conversion is in direct correlation with the amount of knowledge about actual data”
  • “Data profiling tools do not do data profiling - it is done by data analysts using data profiling tools”
  • “Data Profiling does not answer any questions - it helps us ask meaningful questions”
  • “Data quality is measured by its fitness to the purpose of use – it's essential to understand how data is used”
  • “When data has multiple uses, there must be data quality rules for each specific use”
  • “Effective root cause analysis requires not stopping after the answer to your first question - Keep asking: Why?”
  • “The central product of a Data Quality Assessment is the Data Quality Scorecard”
  • “Data quality scores must be both meaningful to a specific data use and be actionable”
  • “Data quality scores must estimate both the cost of bad data and the ROI of data quality initiatives”


Modern Data Quality Techniques in Action - A Demonstration Using Human Resources Data

Gian Di Loreto formed Loreto Services and Technologies in 2004 from the client services division of Arkidata Corporation.  Loreto Services provides data cleansing and integration consulting services to Fortune 500 companies.  Gian is a classically trained scientist - he received his PhD in elementary particle physics from Michigan State University.

Course Quotes from Gian Di Loreto:

  • “Data Quality is rich with theory and concepts – however it is not an academic exercise, it has real business impact”
  • “To do data quality well, you must walk away from the computer and go talk with the people using the data”
  • “Undertaking a data quality initiative demands developing a deeper knowledge of the data and the business”
  • “Some essential data quality rules are ‘hidden’ and can only be discovered by ‘clicking around’ in the data”
  • “Data quality projects are not about systems working together - they are about people working together”
  • “Sometimes, data quality can be ‘good enough’ for source systems but not when integrated with other systems”
  • “Unfortunately, no one seems to care about bad data until they have it”
  • “Data quality projects are only successful when you understand the problem before trying to solve it”


Mark Your Calendar

TDWI World Conference San Diego 2009 - August 2-7, 2009.

TDWI World Conference Orlando 2009 - November 1-6, 2009.

TDWI World Conference Las Vegas 2010 - February 21-26, 2010.