Data Quality in Six Verbs

Once upon a time when asked on Twitter to identify a list of critical topics for data quality practitioners, my pithy (with only 140 characters in a tweet, pithy is as good as it gets) response was, and especially since I prefer emphasizing the need to take action, to propose six critical verbs: Investigate, Communicate, Collaborate, Remediate, Inebriate, and Reiterate.

Lest my pith be misunderstood aplenty, this blog post provides more detail, plus links to related posts, about what I meant.

1 — Investigate

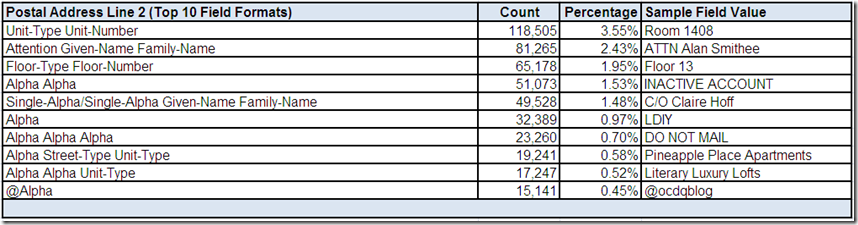
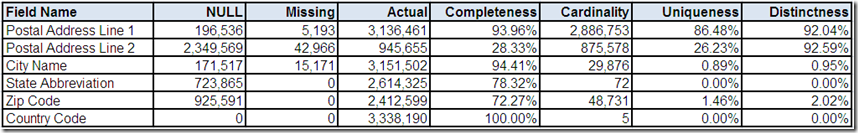
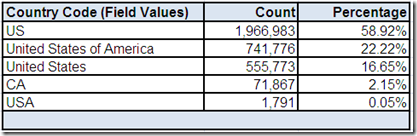
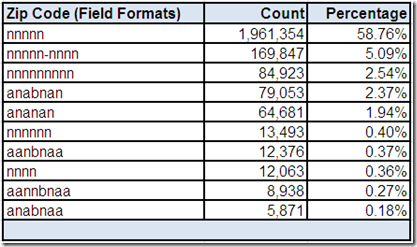
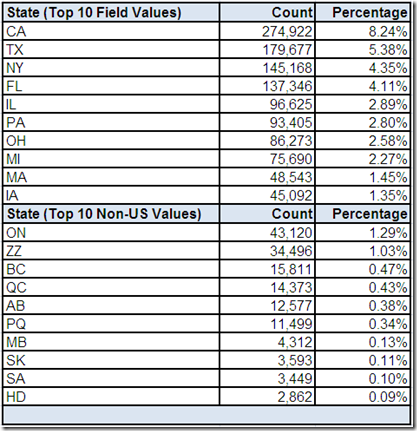
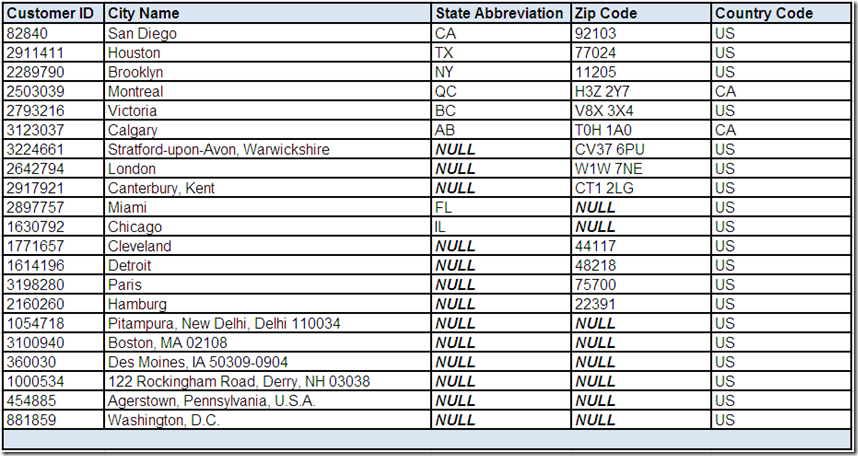
Data quality is not exactly a riddle wrapped in a mystery inside an enigma.  However, understanding your data is essential to using it effectively and improving its quality.  Therefore, the first thing you must do is investigate.

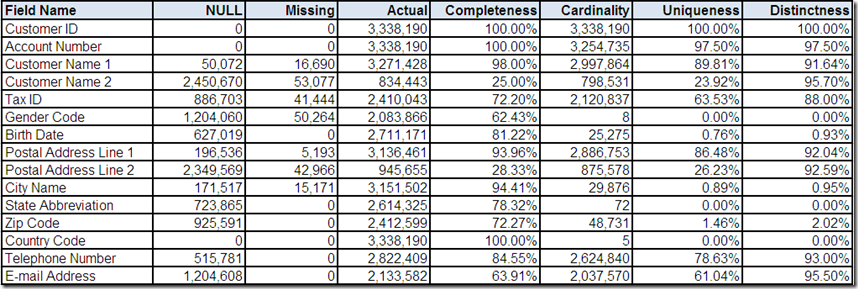
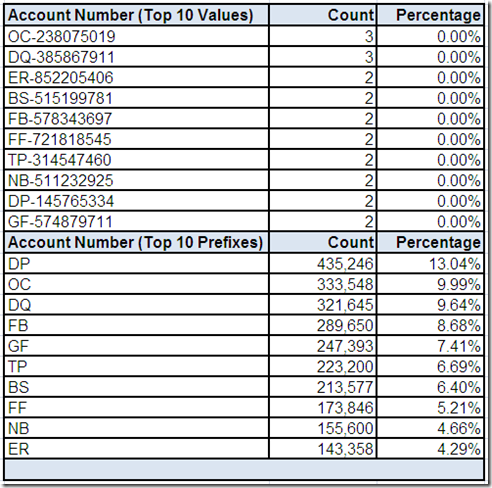
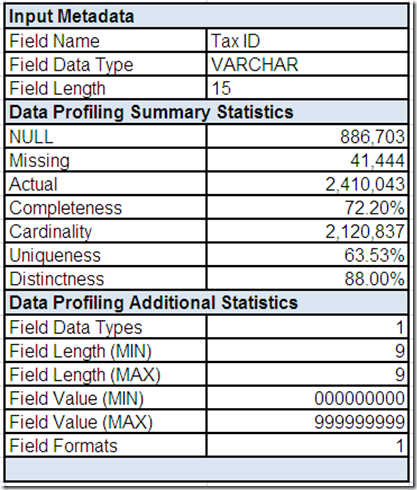
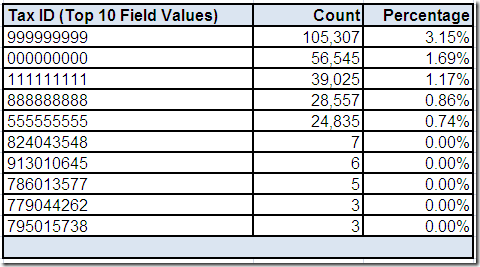
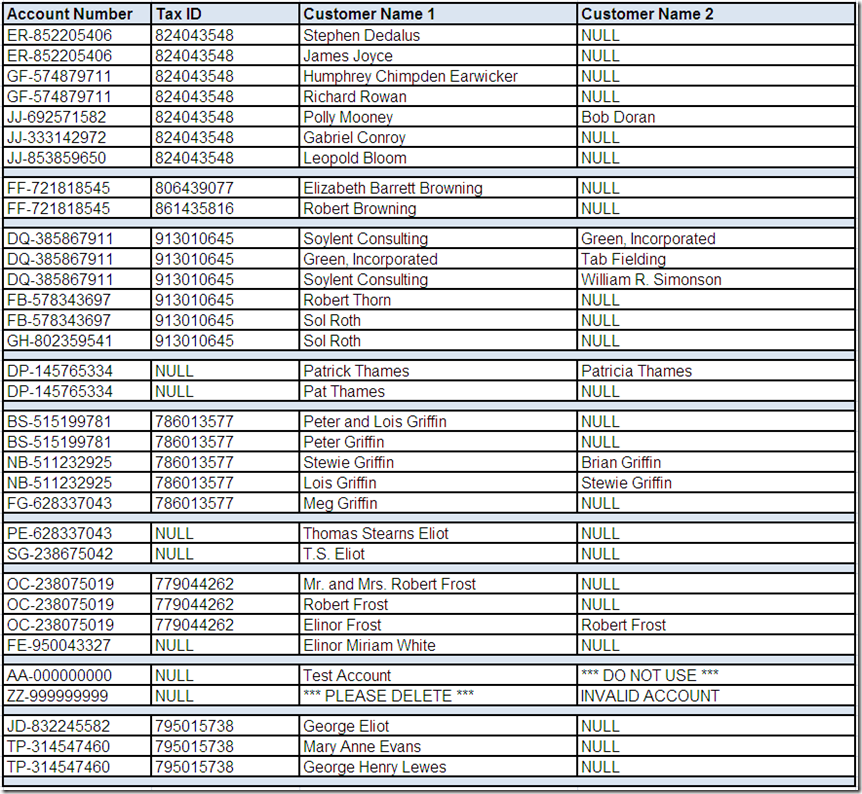
So, grab your favorite (preferably highly caffeinated) beverage, get settled into your comfy chair, roll up your sleeves and starting analyzing that data.  Data profiling tools can be very helpful with raw data analysis.

However, data profiling is elementary, my dear reader.  In order for you to make sense of those data elements, you require business context.  This means you must also go talk with data’s best friends—its stewards, analysts, and subject matter experts.

Six blog posts related to Investigate:

2 — Communicate

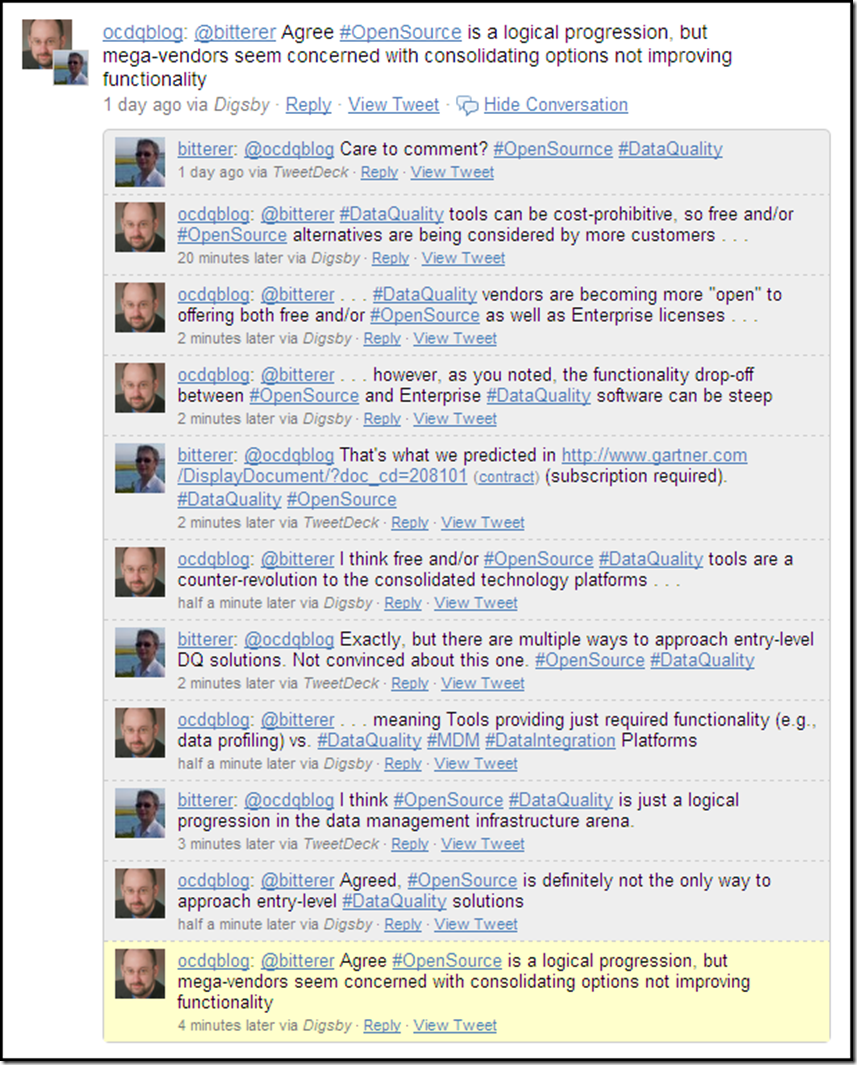
After you have completed your preliminary investigation, the next thing you must do is communicate your findings, which helps improve everyone’s understanding of how data is being used, verify data’s business relevancy, and prioritize critical issues.

Keep in mind that communication is mostly about listening.  Also, be prepared to face “data denial” whenever data quality is discussed.  This is a natural self-defense mechanism for the people responsible for business processes, technology, and data, which is understandable because nobody likes to be blamed (or feel blamed) for causing or failing to fix data quality problems.

No matter how uncomfortable these discussions may be at times, they are essential to evaluating the potential ROI of data quality improvements, defining data quality standards, and most importantly, providing a working definition of success.

Six blog posts related to Communicate:

3 — Collaborate

After you have investigated and communicated, now you must rally the team that will work together to improve the quality of your data.  A cross-disciplinary team will be needed because data quality is neither a business nor a technical issue—it is both.

Therefore, you will need the collaborative effort of business and technical folks.  The business folks usually own the data, or at least the business processes that create it, so they understand its meaning and daily use.  The technical folks usually own the hardware and software comprising your data architecture.  Both sets of folks must realize they are all “one company folk” that must collaborate in order to be successful.

No, you don’t need a folk singer, but you may need an executive sponsor.  The need for collaboration might sound rather simple, but as one of my favorite folk singers taught me, sometimes the hardest thing to learn is the least complicated.

Six blog posts related to Collaborate:

4 — Remediate

Resolving data quality issues requires a combination of data cleansing and defect prevention.  Data cleansing is reactive and its common (and deserved) criticism is that it essentially treats the symptoms without curing the disease. 

Defect prevention is proactive and through root cause analysis and process improvements, it essentially is the cure for the quality ills that ail your data.  However, a data governance framework is often necessary for defect prevention to be successful.  As is patience and understanding since it will require a strategic organizational transformation that doesn’t happen overnight.

The unavoidable reality is that data cleansing is used to correct today’s problems while defect prevention is busy building a better tomorrow for your organization.  Fundamentally, data quality requires a hybrid discipline that combines data cleansing and defect prevention into an enterprise-wide best practice.

Six blog posts related to Remediate:

5 — Inebriate

I am not necessarily advocating that kind of inebriation.  Instead, think Emily Dickinson (i.e., “Inebriate of air am I” – it’s a line from a poem about happiness that, yes, also happens to make a good drinking song). 

My point is that you must not only celebrate your successes, but celebrate them quite publicly.  Channel yet another poet (Walt Whitman) and sound your barbaric yawp over the cubicles of your company: “We just improved the quality of our data!”

Of course, you will need to be more specific.  Declare success using words illustrating the business impact of your achievements, such as mitigated risks, reduced costs, or increased revenues — those three are always guaranteed executive crowd pleasers.

Six blog posts related to Inebriate:

6 — Reiterate

Like the legend of the phoenix, the end is also a new beginning.  Therefore, don’t get too inebriated, since you are not celebrating the end of your efforts.  Your data quality journey has only just begun.  Your continuous monitoring must continue and your ongoing improvements must remain ongoing.  Which is why, despite the tension this reality, and this bad grammatical pun, might cause you, always remember that the tense of all six of these verbs is future continuous.

Six blog posts related to Reiterate:

What Say You?

Please let me know what you think, pithy or otherwise, by posting a comment below.  And feel free to use more than six verbs.

Finding Data Quality

WindowsLiveWriter-FindingDataQuality_F0E9-

Have you ever experienced that sinking feeling, where you sense if you don’t find data quality, then data quality will find you?

In the spring of 2003, Pixar Animation Studios produced one of my all-time favorite Walt Disney Pictures—Finding Nemo

This blog post is an hommage to not only the film, but also to the critically important role into which data quality is cast within all of your enterprise information initiatives, including business intelligence, master data management, and data governance. 

I hope that you enjoy reading this blog post, but most important, I hope you always remember: “Data are friends, not food.”

Data Silos

WindowsLiveWriter-FindingDataQuality_F0E9-

“Mine!  Mine!  Mine!  Mine!  Mine!”

That’s the Data Silo Mantra—and it is also the bane of successful enterprise information management.  Many organizations persist on their reliance on vertical data silos, where each and every business unit acts as the custodian of their own private data—thereby maintaining their own version of the truth.

Impressive business growth can cause an organization to become a victim of its own success.  Significant collateral damage can be caused by this success, and most notably to the organization’s burgeoning information architecture.

Earlier in an organization’s history, it usually has fewer systems and easily manageable volumes of data, thereby making managing data quality and effectively delivering the critical information required to make informed business decisions everyday, a relatively easy task where technology can serve business needs well—especially when the business and its needs are small.

However, as the organization grows, it trades effectiveness for efficiency, prioritizing short-term tactics over long-term strategy, and by seeing power in the hoarding of data, not in the sharing of information, the organization chooses business unit autonomy over enterprise-wide collaboration—and without this collaboration, successful enterprise information management is impossible.

A data silo often merely represents a microcosm of an enterprise-wide problem—and this truth is neither convenient nor kind.

Data Profiling

WindowsLiveWriter-FindingDataQuality_F0E9-

“I see a light—I’m feeling good about my data . . .

Good feeling’s gone—AHH!”

Although it’s not exactly a riddle wrapped in a mystery inside an enigma,  understanding your data is essential to using it effectively and improving its quality—to achieve these goals, there is simply no substitute for data analysis.

Data profiling can provide a reality check for the perceptions and assumptions you may have about the quality of your data.  A data profiling tool can help you by automating some of the grunt work needed to begin your analysis.

However, it is important to remember that the analysis itself can not be automated—you need to translate your analysis into the meaningful reports and questions that will facilitate more effective communication and help establish tangible business context.

Ultimately, I believe the goal of data profiling is not to find answers, but instead, to discover the right questions. 

Discovering the right questions requires talking with data’s best friends—its stewards, analysts, and subject matter experts.  These discussions are a critical prerequisite for determining data usage, standards, and the business relevant metrics for measuring and improving data quality.  Always remember that well performed data profiling is highly interactive and a very iterative process.

Defect Prevention

WindowsLiveWriter-FindingDataQuality_F0E9-

“You, Data-Dude, takin’ on the defects.

You’ve got serious data quality issues, dude.

Awesome.”

Even though it is impossible to truly prevent every problem before it happens, proactive defect prevention is a highly recommended data quality best practice because the more control enforced where data originates, the better the overall quality will be for enterprise information.

Although defect prevention is most commonly associated with business and technical process improvements, after identifying the burning root cause of your data defects, you may predictably need to apply some of the principles of behavioral data quality.

In other words, understanding the complex human dynamics often underlying data defects is necessary for developing far more effective tactics and strategies for implementing successful and sustainable data quality improvements.

Data Cleansing

WindowsLiveWriter-FindingDataQuality_F0E9-

“Just keep cleansing.  Just keep cleansing.

Just keep cleansing, cleansing, cleansing.

What do we do?  We cleanse, cleanse.”

That’s not the Data Cleansing Theme Song—but it can sometimes feel like it.  Especially whenever poor data quality negatively impacts decision-critical information, the organization may legitimately prioritize a reactive short-term response, where the only remediation will be fixing the immediate problems.

Balancing the demands of this data triage mentality with the best practice of implementing defect prevention wherever possible, will often create a very challenging situation for you to contend with on an almost daily basis.

Therefore, although comprehensive data remediation will require combining reactive and proactive approaches to data quality, you need to be willing and able to put data cleansing tools to good use whenever necessary.

Communication

WindowsLiveWriter-FindingDataQuality_F0E9-

“It’s like he’s trying to speak to me, I know it.

Look, you’re really cute, but I can’t understand what you’re saying.

Say that data quality thing again.”

I hear this kind of thing all the time (well, not the “you’re really cute” part).

Effective communication improves everyone’s understanding of data quality, establishes a tangible business context, and helps prioritize critical data issues. 

Keep in mind that communication is mostly about listening.  Also, be prepared to face “data denial” when data quality problems are discussed.  Most often, this is a natural self-defense mechanism for the people responsible for business processes, technology, and data—and because of the simple fact that nobody likes to feel blamed for causing or failing to fix the data quality problems.

The key to effective communication is clarity.  You should always make sure that all data quality concepts are clearly defined and in a language that everyone can understand.  I am not just talking about translating the techno-mumbojumbo, because even business-speak can sound more like business-babbling—and not just to the technical folks.

Additionally, don’t be afraid to ask questions or admit when you don’t know the answers.  Many costly mistakes can be made when people assume that others know (or pretend to know themselves) what key concepts and other terminology actually mean.

Never underestimate the potential negative impacts that the point of view paradox can have on communication.  For example, the perspectives of the business and technical stakeholders can often appear to be diametrically opposed.

Practicing effective communication requires shutting our mouth, opening our ears, and empathically listening to each other, instead of continuing to practice ineffective communication, where we merely take turns throwing word-darts at each other.

Collaboration

WindowsLiveWriter-FindingDataQuality_F0E9-

“Oh and one more thing:

When facing the daunting challenge of collaboration,

Work through it together, don't avoid it.

Come on, trust each other on this one.

Yes—trust—it’s what successful teams do.”

Most organizations suffer from a lack of collaboration, and as noted earlier, without true enterprise-wide collaboration, true success is impossible.

Beyond the data silo problem, the most common challenge for collaboration is the divide perceived to exist between the Business and IT, where the Business usually owns the data and understands its meaning and use in the day-to-day operation of the enterprise, and IT usually owns the hardware and software infrastructure of the enterprise’s technical architecture.

However, neither the Business nor IT alone has all of the necessary knowledge and resources required to truly be successful.  Data quality requires that the Business and IT forge an ongoing and iterative collaboration.

You must rally the team that will work together to improve the quality of your data.  A cross-disciplinary team will truly be necessary because data quality is neither a business issue nor a technical issue—it is both, truly making it an enterprise issue.

Executive sponsors, business and technical stakeholders, business analysts, data stewards, technology experts, and yes, even consultants and contractors—only when all of you are truly working together as a collaborative team, can the enterprise truly achieve great things, both tactically and strategically.

Successful enterprise information management is spelled E—A—C.

Of course, that stands for Enterprises—Always—Collaborate.  The EAC can be one seriously challenging place, dude.

You don’t know if you know what they know, or if they know what you know, but when you know, then they know, you know?

It’s like first you are all like “Whoa!” and they are all like “Whoaaa!” then you are like “Sweet!” and then they are like “Totally!”

This critical need for collaboration might seem rather obvious.  However, as all of the great philosophers have taught us, sometimes the hardest thing to learn is the least complicated.

Okay.  Squirt will now give you a rundown of the proper collaboration technique:

“Good afternoon. We’re gonna have a great collaboration today.

Okay, first crank a hard cutback as you hit the wall.

There’s a screaming bottom curve, so watch out.

Remember: rip it, roll it, and punch it.”

Finding Data Quality

WindowsLiveWriter-FindingDataQuality_F0E9-

As more and more organizations realize the critical importance of viewing data as a strategic corporate asset, data quality is becoming an increasingly prevalent topic of discussion.

However, and somewhat understandably, data quality is sometimes viewed as a small fish—albeit with a “lucky fin”—in a much larger pond.

In other words, data quality is often discussed only in its relation to enterprise information initiatives such as data integration, master data management, data warehousing, business intelligence, and data governance.

There is nothing wrong with this perspective, and as a data quality expert, I admit to my general tendency to see data quality in everything.  However, regardless of the perspective from which you begin your journey, I believe that eventually you will be Finding Data Quality wherever you look as well.

Data Profiling Early and Often

OCDQ Radio is a vendor-neutral podcast about data quality and its related disciplines, produced and hosted by Jim Harris.

On this episode of OCDQ Radio, I discuss data profiling with James Standen, the founder and CEO of nModal Solutions Inc., the makers of Datamartist, which is a fast, easy to use, visual data profiling and transformation tool.

Before founding nModal, James had over 15 years experience in a broad range of roles involving data, ranging from building business intelligence solutions, creating data warehouses and a data warehouse competency center, through to working on data migration and ERP projects in large organizations.  You can learn more about and connect with James Standen on LinkedIn.

James thinks that while there is obviously good data and bad data, that often bad data is just misunderstood and can be coaxed away from the dark side if you know how to approach it.  He does recommend wearing the proper safety equipment however, and having the right tools.  For more of his wit and wisdom, follow Datamartist on Twitter, and read the Datamartist Blog.

Popular OCDQ Radio Episodes

Clicking on the link will take you to the episode’s blog post:

  • Demystifying Data Science — Guest Melinda Thielbar, a Ph.D. Statistician, discusses what a data scientist does and provides a straightforward explanation of key concepts such as signal-to-noise ratio, uncertainty, and correlation.
  • Data Quality and Big Data — Guest Tom Redman (aka the “Data Doc”) discusses Data Quality and Big Data, including if data quality matters less in larger data sets, and if statistical outliers represent business insights or data quality issues.
  • Demystifying Master Data Management — Guest John Owens explains the three types of data (Transaction, Domain, Master), the four master data entities (Party, Product, Location, Asset), and the Party-Role Relationship, which is where we find many of the terms commonly used to describe the Party master data entity (e.g., Customer, Supplier, Employee).
  • Data Governance Star Wars — Special Guests Rob Karel and Gwen Thomas joined this extended, and Star Wars themed, discussion about how to balance bureaucracy and business agility during the execution of data governance programs.
  • The Johari Window of Data Quality — Guest Martin Doyle discusses helping people better understand their data and assess its business impacts, not just the negative impacts of bad data quality, but also the positive impacts of good data quality.
  • Studying Data Quality — Guest Gordon Hamilton discusses the key concepts from recommended data quality books, including those which he has implemented in his career as a data quality practitioner.

Data Qualia

In philosophy (according to Wikipedia), the term qualia is used to describe the subjective quality of conscious experience.

Examples of qualia are the pain of a headache, the taste of wine, or the redness of an evening sky.  As Daniel Dennett explains:

“Qualia is an unfamiliar term for something that could not be more familiar to each of us:

The ways things seem to us.”

Like truth, beauty, and singing ability, data quality is in the eyes of the beholder, or since data quality is most commonly defined as fitness for the purpose of use, we could say that data quality is in the eyes of the user.

However, most data has both multiple uses and multiple users.  Data of sufficient quality for one use or one user may not be of sufficient quality for other uses and other users.  Quite often these diverse data needs and divergent data quality perspectives make it a daunting challenge to provide meaningful data quality metrics to the organization.

Recently on the Data Roundtable, Dylan Jones of Data Quality Pro discussed the need to create data quality reports that matter, explaining that if you’re relying on canned data profiling reports (i.e., column statistics and data quality metrics at an attribute, table, and system level), then you are measuring data quality in isolation of how the business is performing.

Instead, data quality metrics must measure data qualia—the subjective quality of the user’s business experience with data:

“Data Qualia is an unfamiliar term for something that must become more familiar to the organization:

The ways data quality impact business performance.”

Related Posts

The Point of View Paradox

DQ-BE: Single Version of the Time

Single Version of the Truth

Beyond a “Single Version of the Truth”

The Idea of Order in Data

Hell is other people’s data

DQ-BE: Data Quality Airlines

DQ-Tip: “There is no such thing as data accuracy...”

Data Quality and the Cupertino Effect

DQ-Tip: “Data quality is primarily about context not accuracy...”

Alternatives to Enterprise Data Quality Tools

The recent analysis by Andy Bitterer of Gartner Research (and ANALYSTerical) about the acquisition of open source data quality tool DataCleaner by the enterprise data quality vendor Human Inference, prompted the following Twitter conversation:

Since enterprise data quality tools can be cost-prohibitive, more prospective customers are exploring free and/or open source alternatives, such as the Talend Open Profiler, licensed under the open source General Public License, or non-open source, but entirely free alternatives, such as the Ataccama DQ Analyzer.  And, as Andy noted in his analysis, both of these tools offer an easy transition to the vendors’ full-fledged commercial data quality tools, offering more than just data profiling functionality.

As Henrik Liliendahl Sørensen explained, in his blog post Data Quality Tools Revealed, data profiling is the technically easiest part of data quality, which explains the tool diversity, and early adoption of free and/or open source alternatives.

And there are also other non-open source alternatives that are more affordable than enterprise data quality tools, such as Datamartist, which combines data profiling and data migration capabilities into an easy-to-use desktop application.

My point is neither to discourage the purchase of enterprise data quality tools, nor promote their alternatives—and this blog post is certainly not an endorsement—paid or otherwise—of the alternative data quality tools I have mentioned simply as examples.

My point is that many new technology innovations originate from small entrepreneurial ventures, which tend to be specialists with a narrow focus that can provide a great source of rapid innovation.  This is in contrast to the data management industry trend of innovation via acquisition and consolidation, embedding data quality technology within data management platforms, which also provide data integration and master data management (MDM) functionality as well, allowing the mega-vendors to offer end-to-end solutions and the convenience of one-vendor information technology shopping.

However, most software licenses for these enterprise data management platforms start in the six figures.  On top of the licensing, you have to add the annual maintenance fees, which are usually in the five figures.  Add to the total cost of the solution, the professional services that are needed for training and consulting for installation, configuration, application development, testing, and production implementation—and you have another six figure annual investment.

Debates about free and/or open source software usually focus on the robustness of functionality and the intellectual property of source code.  However, from my perspective, I think that the real reason more prospective customers are exploring these alternatives to enterprise data quality tools is because of the free aspect—but not because of the open source aspect.

In other words—and once again I am only using it as an example—I might download Talend Open Profiler because I wanted data profiling functionality at an affordable price—but not because I wanted the opportunity to customize its source code.

I believe the “try it before you buy it” aspect of free and/or open source software is what’s important to prospective customers.

Therefore, enterprise data quality vendors, instead of acquiring an open source tool as Human Inference did with DataCleaner, how about offering a free (with limited functionality) or trial version of your enterprise data quality tool as an alternative option?


Related Posts

Do you believe in Magic (Quadrants)?

Can Enterprise-Class Solutions Ever Deliver ROI?

Which came first, the Data Quality Tool or the Business Need?

Selling the Business Benefits of Data Quality

What Data Quality Technology Wants

I’m Gonna Data Profile (500 Records)

While researching my blog post (to be published on December 31) about the best data quality blog posts of the year, I re-read the great post Profound Profiling by Daragh O Brien, which recounted how he found data profiling cropping up in conversations and presentations he’d made this year, even where the topic of the day wasn’t “Information Quality” and shared his thoughts on the profound business benefits of data profiling for organizations seeking to manage risk and ensure compliance.

And I noticed that I had actually commented on this blog post . . . with song lyrics . . .


I’m Gonna Data Profile (500 Records) *

When I wake up, well I know I’m gonna be,
I’m gonna be the one who profiles early and often for you
When I go out, yeah I know I’m gonna be
I’m gonna be the one who goes along with data
If I get drunk, well I know I’m gonna be
I’m gonna be the one who gets drunk on managing risk for you
And if I haver up, yeah I know I’m gonna be
I’m gonna be the one who’s havering about how: “It’s the Information, Stupid!”

But I would profile 500 records
And I would profile 500 more
Just to be the one who profiles a thousand records
To deliver the profound business benefits of data profiling to your door

da da da da – ta ta ta ta
da da da da – ta ta ta ta – data!
da da da da – ta ta ta ta
da da da da – ta ta ta ta – data profiling!

When I’m working, yes I know I’m gonna be
I’m gonna be the one who’s working hard to ensure compliance for you
And when the money, comes in for the work I do
I’ll pass almost every penny on to improving data for you
When I come home (When I come home), well I know I’m gonna be
I’m gonna be the one who comes back home with data quality
And if I grow-old, (When I grow-old) well I know I’m gonna be
I’m gonna be the one who’s growing old with information quality

But I would profile 500 records
And I would profile 500 more
Just to be the one who profiles a thousand records
To deliver the profound business benefits of data profiling to your door

da da da da – ta ta ta ta
da da da da – ta ta ta ta – data!
da da da da – ta ta ta ta
da da da da – ta ta ta ta – data profiling!

When I’m lonely, well I know I’m gonna be
I’m gonna be the one who’s lonely without data profiling to do
And when I’m dreaming, well I know I’m gonna dream
I’m gonna dream about the time when I’m data profiling for you
When I go out (When I go out), well I know I’m gonna be
I’m gonna be the one who goes along with data
And when I come home (When I come home), yes I know I’m gonna be
I’m gonna be the one who comes back home with data quality
I’m gonna be the one who’s coming home with information quality

But I would profile 500 records
And I would profile 500 more
Just to be the one who profiles a thousand records
To deliver the profound business benefits of data profiling to your door

da da da da – ta ta ta ta
da da da da – ta ta ta ta – data!
da da da da – ta ta ta ta
da da da da – ta ta ta ta – data profiling!

___________________________________________________________________________________________________________________

* Based on the 1988 song I’m Gonna Be (500 Miles) by The Proclaimers.


Data Quality Music (DQ-Songs)

Over the Data Governance Rainbow

A Record Named Duplicate

New Time Human Business

People

You Can’t Always Get the Data You Want

A spoonful of sugar helps the number of data defects go down

Data Quality is such a Rush

I’m Bringing DQ Sexy Back

Imagining the Future of Data Quality

The Very Model of a Modern DQ General

The Real Data Value is Business Insight

Data Values for COUNTRY Understanding your data usage is essential to improving its quality, and therefore, you must perform data analysis on a regular basis.

A data profiling tool can help you by automating some of the grunt work needed to begin your data analysis, such as generating levels of statistical summaries supported by drill-down details, including data value frequency distributions (like the ones shown to the left).

However, a common mistake is to hyper-focus on the data values.

Narrowing your focus to the values of individual fields is a mistake when it causes you to lose sight of the wider context of the data, which can cause other errors like mistaking validity for accuracy.

Understanding data usage is about analyzing its most important context—how your data is being used to make business decisions.


“Begin with the decision in mind”

In his excellent recent blog post It’s time to industrialize analytics, James Taylor wrote that “organizations need to be much more focused on directing analysts towards business problems.”  Although Taylor was writing about how, in advanced analytics (e.g., data mining, predictive analytics), “there is a tendency to let analysts explore the data, see what can be discovered,” I think this tendency is applicable to all data analysis, including less advanced analytics like data profiling and data quality assessments.

Please don’t misunderstand—Taylor and I are not saying that there is no value in data exploration, because, without question, it can definitely lead to meaningful discoveries.  And I continue to advocate that the goal of data profiling is not to find answers, but instead, to discover the right questions.

However, as Taylor explained, it is because “the only results that matter are business results” that data analysis should always “begin with the decision in mind.  Find the decisions that are going to make a difference to business results—to the metrics that drive the organization.  Then ask the analysts to look into those decisions and see what they might be able to predict that would help make better decisions.”

Once again, although Taylor is discussing predictive analytics, this cogent advice should guide all of your data analysis.


The Real Data Value is Business Insight

The Real Data Value is Business Insight

Returning to data quality assessments, which create and monitor metrics based on summary statistics provided by data profiling tools (like the ones shown in the mockup to the left), elevating what are low-level technical metrics up to the level of business relevance will often establish their correlation with business performance, but will not establish metrics that drive—or should drive—the organization.

Although built from the bottom-up by using, for the most part, the data value frequency distributions, these metrics lose sight of the top-down fact that business insight is where the real data value lies.

However, data quality metrics such as completeness, validity, accuracy, and uniqueness, which are just a few common examples, should definitely be created and monitored—unfortunately, a single straightforward metric called Business Insight doesn’t exist.

But let’s pretend that my other mockup metrics were real—50% of the data is inaccurate and there is an 11% duplicate rate.

Oh, no!  The organization must be teetering on the edge of oblivion, right?  Well, 50% accuracy does sound really bad, basically like your data’s accuracy is no better than flipping a coin.  However, which data is inaccurate, and far more important, is the inaccurate data actually being used to make a business decision?

As for the duplicate rate, I am often surprised by the visceral reaction it can trigger, such as: “how can we possibly claim to truly understand who our most valuable customers are if we have an 11% duplicate rate?”

So, would reducing your duplicate rate to only 1% automatically result in better customer insight?  Or would it simply mean that the data matching criteria was too conservative (e.g., requiring an exact match on all “critical” data fields), preventing you from discovering how many duplicate customers you have?  (Or maybe the 11% indicates the matching criteria was too aggressive).

My point is that accuracy and duplicate rates are just numbers—what determines if they are a good number or a bad number?

The fundamental question that every data quality metric you create must answer is: How does this provide business insight?

If a data quality (or any other data) metric can not answer this question, then it is meaningless.  Meaningful metrics always represent business insight because they were created by beginning with the business decisions in mind.  Otherwise, your metrics could provide the comforting, but false, impression that all is well, or you could raise red flags that are really red herrings.

Instead of beginning data analysis with the business decisions in mind, many organizations begin with only the data in mind, which results in creating and monitoring data quality metrics that provide little, if any, business insight and decision support.

Although analyzing your data values is important, you must always remember that the real data value is business insight.


Related Posts

The First Law of Data Quality

Adventures in Data Profiling

Data Quality and the Cupertino Effect

Is your data complete and accurate, but useless to your business?

The Idea of Order in Data

You Can’t Always Get the Data You Want

Red Flag or Red Herring? 

DQ-Tip: “There is no point in monitoring data quality…”

Which came first, the Data Quality Tool or the Business Need?

Selling the Business Benefits of Data Quality

Adventures in Data Profiling

Data profiling is a critical step in a variety of information management projects, including data quality initiatives, MDM implementations, data migration and consolidation, building a data warehouse, and many others.

Understanding your data is essential to using it effectively and improving its quality – and to achieve these goals, there is simply no substitute for data analysis.


Webinar

In this vendor-neutral eLearningCurve webinar, I discuss the common functionality provided by data profiling tools, which can help automate some of the work needed to begin your preliminary data analysis.

You can download (no registration required) the webinar (.wmv file) using this link: Adventures in Data Profiling Webinar


Presentation

You can download the presentation (no registration required) used in the webinar as an Adobe Acrobat Document (.pdf file) using this link: Adventures in Data Profiling Presentation


Complete Blog Series

You can read (no registration required) the complete OCDQ blog series Adventures in Data Profiling by following these links:

Adventures in Data Profiling (Part 8)

Understanding your data is essential to using it effectively and improving its quality – and to achieve these goals, there is simply no substitute for data analysis.  This post is the conclusion of a vendor-neutral series on the methodology of data profiling.

Data profiling can help you perform essential analysis such as:

  • Provide a reality check for the perceptions and assumptions you may have about the quality of your data
  • Verify your data matches the metadata that describes it
  • Identify different representations for the absence of data (i.e., NULL and other missing values)
  • Identify potential default values
  • Identify potential invalid values
  • Check data formats for inconsistencies
  • Prepare meaningful questions to ask subject matter experts

Data profiling can also help you with many of the other aspects of domain, structural and relational integrity, as well as determining functional dependencies, identifying redundant storage, and other important data architecture considerations.


Adventures in Data Profiling

This series was carefully designed as guided adventures in data profiling in order to provide the necessary framework for demonstrating and discussing the common functionality of data profiling tools and the basic methodology behind using one to perform preliminary data analysis.

In order to narrow the scope of the series, the scenario used was a customer data source for a new data quality initiative had been made available to an external consultant with no prior knowledge of the data or its expected characteristics.  Additionally, business requirements had not yet been documented, and subject matter experts were not currently available.

This series did not attempt to cover every possible feature of a data profiling tool or even every possible use of the features that were covered.  Both the data profiling tool and data used throughout the series were fictional.  The “screen shots” were customized to illustrate concepts and were not modeled after any particular data profiling tool.

This post summarizes the lessons learned throughout the series, and is organized under three primary topics:

  1. Counts and Percentages
  2. Values and Formats
  3. Drill-down Analysis


Counts and Percentages

One of the most basic features of a data profiling tool is the ability to provide counts and percentages for each field that summarize its content characteristics:

 Data Profiling Summary

  • NULL – count of the number of records with a NULL value 
  • Missing – count of the number of records with a missing value (i.e., non-NULL absence of data, e.g., character spaces) 
  • Actual – count of the number of records with an actual value (i.e., non-NULL and non-Missing) 
  • Completeness – percentage calculated as Actual divided by the total number of records 
  • Cardinality – count of the number of distinct actual values 
  • Uniqueness – percentage calculated as Cardinality divided by the total number of records 
  • Distinctness – percentage calculated as Cardinality divided by Actual

Completeness and uniqueness are particularly useful in evaluating potential key fields and especially a single primary key, which should be both 100% complete and 100% unique.  In Part 2, Customer ID provided an excellent example.

Distinctness can be useful in evaluating the potential for duplicate records.  In Part 6, Account Number and Tax ID were used as examples.  Both fields were less than 100% distinct (i.e., some distinct actual values occurred on more than one record).  The implied business meaning of these fields made this an indication of possible duplication.

Data profiling tools generate other summary statistics including: minimum/maximum values, minimum/maximum field sizes, and the number of data types (based on analyzing the values, not the metadata).  Throughout the series, several examples were provided, especially in Part 3 during the analysis of Birth Date, Telephone Number and E-mail Address.


Values and Formats

In addition to counts, percentages, and other summary statistics, a data profiling tool generates frequency distributions for the unique values and formats found within the fields of your data source.

A frequency distribution of unique values is useful for:

  • Fields with an extremely low cardinality, indicating potential default values (e.g., Country Code in Part 4)
  • Fields with a relatively low cardinality (e.g., Gender Code in Part 2)
  • Fields with a relatively small number of known valid values (e.g., State Abbreviation in Part 4)

A frequency distribution of unique formats is useful for:

  • Fields expected to contain a single data type and/or length (e.g., Customer ID in Part 2)
  • Fields with a relatively limited number of known valid formats (e.g., Birth Date in Part 3)
  • Fields with free-form values and a high cardinality (e.g., Customer Name 1 and Customer Name 2 in Part 7)

Cardinality can play a major role in deciding whether you want to be shown values or formats since it is much easier to review all of the values when there are not very many of them.  Alternatively, the review of high cardinality fields can also be limited to the most frequently occurring values, as we saw throughout the series (e.g., Telephone Number in Part 3).

Some fields can also be analyzed using partial values (e.g., in Part 3, Birth Year was extracted from Birth Date) or a combination of values and formats (e.g., in Part 6, Account Number had an alpha prefix followed by all numbers).

Free-form fields are often easier to analyze as formats constructed by parsing and classifying the individual values within the field.  This analysis technique is often necessary since not only is the cardinality of free-form fields usually very high, but they also tend to have a very high distinctness (i.e., the exact same field value rarely occurs on more than one record). 

Additionally, the most frequently occurring formats for free-form fields will often collectively account for a large percentage of the records with an actual value in the field.  Examples of free-form field analysis were the focal points of Part 5 and Part 7.

We also saw examples of how valid values in a valid format can have an invalid context (e.g., in Part 3, Birth Date values set in the future), as well as how valid field formats can conceal invalid field values (e.g., Telephone Number in Part 3).

Part 3 also provided examples (in both Telephone Number and E-mail Address) of how you should not mistake completeness (which as a data profiling statistic indicates a field is populated with an actual value) for an indication the field is complete in the sense that its value contains all of the sub-values required to be considered valid. 


Drill-down Analysis

A data profiling tool will also provide the capability to drill-down on its statistical summaries and frequency distributions in order to perform a more detailed review of records of interest.  Drill-down analysis will often provide useful data examples to share with subject matter experts.

Performing a preliminary analysis on your data prior to engaging in these discussions better facilitates meaningful dialogue because real-world data examples better illustrate actual data usage.  As stated earlier, understanding your data is essential to using it effectively and improving its quality.

Various examples of drill-down analysis were used throughout the series.  However, drilling all the way down to the record level was shown in Part 2 (Gender Code), Part 4 (City Name), and Part 6 (Account Number and Tax ID).


Conclusion

Fundamentally, this series posed the following question: What can just your analysis of data tell you about it?

Data profiling is typically one of the first tasks performed on a data quality initiative.  I am often told to delay data profiling until business requirements are documented and subject matter experts are available to answer my questions. 

I always disagree – and begin data profiling as soon as possible.

I can do a better job of evaluating business requirements and preparing for meetings with subject matter experts after I have spent some time looking at data from a starting point of blissful ignorance and curiosity.

Ultimately, I believe the goal of data profiling is not to find answers, but instead, to discover the right questions.

Discovering the right questions is a critical prerequisite for effectively discussing data usage, relevancy, standards, and the metrics for measuring and improving quality.  All of which are necessary in order to progress from just profiling your data, to performing a full data quality assessment (which I will cover in a future series on this blog).

A data profiling tool can help you by automating some of the grunt work needed to begin your analysis.  However, it is important to remember that the analysis itself can not be automated – you need to review the statistical summaries and frequency distributions generated by the data profiling tool and more important translate your analysis into meaningful reports and questions to share with the rest of your team. 

Always remember that well performed data profiling is both a highly interactive and a very iterative process.


Thank You

I want to thank you for providing your feedback throughout this series. 

As my fellow Data Gazers, you provided excellent insights and suggestions via your comments. 

The primary reason I published this series on my blog, as opposed to simply writing a whitepaper or a presentation, was because I knew our discussions would greatly improve the material.

I hope this series proves to be a useful resource for your actual adventures in data profiling.


The Complete Series


Adventures in Data Profiling (Part 7)

In Part 6 of this seriesYou completed your initial analysis of the Account Number and Tax ID fields. 

Previously during your adventures in data profiling, you have looked at customer name within the context of other fields.  In Part 2, you looked at the associated customer names during drill-down analysis on the Gender Code field while attempting to verify abbreviations as well as assess NULL and numeric values.  In Part 6, you investigated customer names during drill-down analysis for the Account Number and Tax ID fields while assessing the possibility of duplicate records. 

In Part 7 of this award-eligible series, you will complete your initial analysis of this data source with direct investigation of the Customer Name 1 and Customer Name 2 fields.


Previously, the data profiling tool provided you with the following statistical summaries for customer names:

Customer Name Summary

As we discussed when we looked at the E-mail Address field (in Part 3) and the Postal Address Line fields (in Part 5), most data profiling tools will provide the capability to analyze fields using formats that are constructed by parsing and classifying the individual values within the field.

Customer Name 1 and Customer Name 2 are additional examples of the necessity of this analysis technique.  Not only are the cardinality of these fields very high, but they also have a very high Distinctness (i.e. the exact same field value rarely occurs on more than one record).


Customer Name 1

The data profiling tool has provided you the following drill-down “screen” for Customer Name 1:

Field Formats for Customer Name 1 

Please Note: The differentiation between given and family names has been based on our fictional data profiling tool using probability-driven non-contextual classification of the individual field values. 

For example, Harris, Edward, and James are three of the most common names in the English language, and although they can also be family names, they are more frequently given names.  Therefore, “Harris Edward James” is assigned “Given-Name Given-Name Given-Name” for a field format.  For this particular example, how do we determine the family name?

The top twenty most frequently occurring field formats for Customer Name 1 collectively account for over 80% of the records with an actual value in this field for this data source.  All of these field formats appear to be common potentially valid structures.  Obviously, more than one sample field value would need to be reviewed using more drill-down analysis. 

What conclusions, assumptions, and questions do you have about the Customer Name 1 field?


Customer Name 2

The data profiling tool has provided you the following drill-down “screen” for Customer Name 2:

Field Formats for Customer Name 2 

The top ten most frequently occurring field formats for Customer Name 2 collectively account for over 50% of the records with an actual value in this sparsely populated field for this data source.  Some of these field formats show common potentially valid structures.  Again, more than one sample field value would need to be reviewed using more drill-down analysis.

What conclusions, assumptions, and questions do you have about the Customer Name 2 field?


The Challenges of Person Names

Not that business names don't have their own challenges, but person names present special challenges.  Many data quality initiatives include the business requirement to parse, identify, verify, and format a “valid” person name.  However, unlike postal addresses where country-specific postal databases exist to support validation, no such “standards” exist for person names.

In his excellent book Viral Data in SOA: An Enterprise Pandemic, Neal A. Fishman explains that “a person's name is a concept that is both ubiquitous and subject to regional variations.  For example, the cultural aspects of an individual's name can vary.  In lieu of last name, some cultures specify a clan name.  Others specify a paternal name followed by a maternal name, or a maternal name followed by a paternal name; other cultures use a tribal name, and so on.  Variances can be numerous.”

“In addition,” continues Fishman, “a name can be used in multiple contexts, which might affect what parts should or could be communicated.  An organization reporting an employee's tax contributions might report the name by using the family name and just the first letter (or initial) of the first name (in that sequence).  The same organization mailing a solicitation might choose to use just a title and a family name.”

However, it is not a simple task to identify what part of a person's name is the family name or the first given name (as some of the above data profiling sample field values illustrate).  Again, regional, cultural, and linguistic variations can greatly complicate what at first may appear to be a straightforward business request (e.g. formatting a person name for a mailing label).

As Fishman cautions, “many regions have cultural name profiles bearing distinguishing features for words, sequences, word frequencies, abbreviations, titles, prefixes, suffixes, spelling variants, gender associations, and indications of life events.”

If you know of any useful resources for dealing with the challenges of person names, then please share them by posting a comment below.  Additionally, please share your thoughts and experiences regarding the challenges (as well as useful resources) associated with business names.


What other analysis do you think should be performed for customer names?


In Part 8 of this series:  We will conclude the adventures in data profiling with a summary of the lessons learned.


Related Posts

Adventures in Data Profiling (Part 1)

Adventures in Data Profiling (Part 2)

Adventures in Data Profiling (Part 3)

Adventures in Data Profiling (Part 4)

Adventures in Data Profiling (Part 5)

Adventures in Data Profiling (Part 6)

Getting Your Data Freq On

Adventures in Data Profiling (Part 6)

In Part 5 of this seriesYou completed your initial analysis of the fields relating to postal address with the investigation of Postal Address Line 1 and Postal Address Line 2.

You saw additional examples of why free-form fields are often easier to analyze as formats constructed by parsing and classifying the individual values within the field. 

You learned this analysis technique is often necessary since not only is the cardinality of free-form fields usually very high, but they also tend to have a very high Distinctness (i.e. the exact same field value rarely occurs on more than one record). 

You also saw examples of how the most frequently occurring formats for free-form fields will often collectively account for a large percentage of the records with an actual value in the field.

In Part 6, you will continue your adventures in data profiling by analyzing the Account Number and Tax ID fields.


Account Number

Field Summary for Account Number

  The field summary for Account Number includes input metadata along with the summary and additional statistics provided by the data profiling tool.

  In Part 2, we learned that Customer ID is likely an integer surrogate key and the primary key for this data source because it is both 100% complete and 100% unique.  Account Number is 100% complete and almost 100% unique.  Perhaps it was intended to be the natural key for this data source?   

  Let's assume that drill-downs revealed the single profiled field data type was VARCHAR and the single profiled field format was aa-nnnnnnnnn (i.e. 2 characters, followed by a hyphen, followed by a 9 digit number).

  Combined with the profiled minimum/maximum field lengths, the good news appears to be that not only is Account Number always populated, it is also consistently formatted. 

  The profiled minimum/maximum field values appear somewhat suspicious, possibly indicating the presence of invalid values?


Field Values for Account Number

  We can use drill-downs on the field summary “screen” to get more details about Account Number provided by the data profiling tool.

  The cardinality of Account Number is very high, as is its Distinctness (i.e. the same field value rarely occurs on more than one record).  Therefore, when we limit the review to only the top ten most frequently occurring values, it is not surprising to see low counts.

  Since we do not yet have a business understanding of the data, we are not sure if it is valid for multiple records to have the same Account Number

  Additional analysis can be performed by extracting the alpha prefix and reviewing its top ten most frequently occurring values.  One aspect of this analysis is that it can be used to assess the possibility that Account Number is an “intelligent key.”  Perhaps the alpha prefix is a source system code?


Tax ID

Field Summary for Tax ID

   The field summary for Tax ID includes input metadata along with the summary and additional statistics provided by the data profiling tool.

  Let's assume that drill-downs revealed the single profiled field data type was INTEGER and the single profiled field format was nnnnnnnnn (i.e. a 9 digit number).

  Combined with the profiled minimum/maximum field lengths, the good news appears to be that Tax ID is also consistently formatted.  However, the profiled minimum/maximum field values appear to indicate the presence of invalid values.

  In Part 4, we learned that most of the records appear to have either an United States (US) or Canada (CA) postal address.  For US records, the Tax ID field could represent the social security number (SSN), federal employer identification number (FEIN), or tax identification number (TIN).  For CA records, this field could represent the social insurance number (SIN).  All of these identifiers are used for tax reporting purposes and have a 9 digit number format (when no presentation formatting is used).


Field Values for Tax ID

  We can use drill-downs on the field summary “screen” to get more details about Tax ID provided by the data profiling tool.

  The Distinctness of Tax ID is slightly lower than Account Number and therefore the same field value does occasionally occur on more than one record.

  Since the cardinality of Tax ID is very high, we will limit the review to only the top ten most frequently occurring values.  This analysis reveals the presence of more (most likely) invalid values.


Potential Duplicate Records

In Part 1, we asked if the data profiling statistics for Account Number and/or Tax ID indicate the presence of potential duplicate records.  In other words, since some distinct actual values for these fields occur on more than one record, does this imply more than just a possible data relationship, but a possible data redundancy?  Obviously, we would need to interact with the business team in order to better understand the data and their business rules for identifying duplicate records.

However, let's assume that we have performed drill-down analysis using the data profiling tool and have selected the following records of interest:

Record Drill-down for Account Number and Tax ID


What other analysis do you think should be performed for these fields?


In Part 7 of this series:  We will continue the adventures in data profiling by completing our initial analysis with the investigation of the Customer Name 1 and Customer Name 2 fields.


Related Posts

Adventures in Data Profiling (Part 1)

Adventures in Data Profiling (Part 2)

Adventures in Data Profiling (Part 3)

Adventures in Data Profiling (Part 4)

Adventures in Data Profiling (Part 5)

Adventures in Data Profiling (Part 7)

Getting Your Data Freq On

To Parse or Not To Parse

“To Parse, or Not To Parse,—that is the question:
Whether 'tis nobler in the data to suffer
The slings and arrows of free-form fields,
Or to take arms against a sea of information,
And by parsing, understand them?”

Little known fact: before William Shakespeare made it big as a playwright, he was a successful data quality consultant. 

Alas, poor data quality!  The Bard of Avon knew it quite well.  And he was neither a fan of free verse nor free-form fields.


Free-Form Fields

A free-form field contains multiple (usually interrelated) sub-fields.  Perhaps the most common examples of free-form fields are customer name and postal address.

A Customer Name field with the value “Christopher Marlowe” is comprised of the following sub-fields and values:

  • Given Name = “Christopher”
  • Family Name = “Marlowe”

A Postal Address field with the value “1587 Tambur Lane” is comprised of the following sub-fields and values:

  • House Number = “1587”
  • Street Name = “Tambur”
  • Street Type = “Lane”

Obviously, both of these examples are simplistic.  Customer name and postal address are comprised of additional sub-fields, not all of which will be present on every record or represented consistently within and across data sources.

Returning to the bard's question, a few of the data quality reasons to consider parsing free-form fields include:

  • Data Profiling
  • Data Standardization
  • Data Matching


Much Ado About Analysis

Free-form fields are often easier to analyze as formats constructed by parsing and classifying the individual values within the field.  In Adventures in Data Profiling (Part 5), a data profiling tool was used to analyze the field Postal Address Line 1:

Field Formats for Postal Address Line 1


The Taming of the Variations

Free-form fields often contain numerous variations resulting from data entry errors, different conventions for representing the same value, and a general lack of data quality standards.  Additional variations are introduced by multiple data sources, each with its own unique data characteristics and quality challenges.

Data standardization parses free-form fields to break them down into their smaller individual sub-fields to gain improved visibility of the available input data.  Data standardization is the taming of the variations that creates a consistent representation, applies standard values where appropriate, and when possible, populates missing values.

The following example shows parsed and standardized postal addresses:

Parsed and Standardized Postal Address

In your data quality implementations, do you use this functionality for processing purposes only?  If you retain the standardized results, do you store the parsed and standardized sub-fields or just the standardized free-form value?


Shall I compare thee to other records?

Data matching often uses data standardization to prepare its input.  This allows for more direct and reliable comparisons of parsed sub-fields with standardized values, decreases the failure to match records because of data variations, and increases the probability of effective match results.

Imagine matching the following product description records with and without the parsed and standardized sub-fields:

Parsed and Standardized Product Description


Doth the bard protest too much? 

Please share your thoughts and experiences regarding free-form fields.

Adventures in Data Profiling (Part 5)

In Part 4 of this series:  You went totally postal...shifting your focus to postal address by first analyzing the following fields: City Name, State Abbreviation, Zip Code and Country Code.

You learned when a field is both 100% complete and has an extremely low cardinality, its most frequently occurring value could be its default value, how forcing international addresses to be entered into country-specific data structures can cause data quality problems, and with the expert assistance of Graham Rhind, we all learned more about international postal code formats.

In Part 5, you will continue your adventures in data profiling by completing your initial analysis of postal address by investigating the following fields: Postal Address Line 1 and Postal Address Line 2.


Previously, the data profiling tool provided you with the following statistical summaries for postal address:

Postal Address Summary

As we discussed in Part 3 when we looked at the E-mail Address field, most data profiling tools will provide the capability to analyze fields using formats that are constructed by parsing and classifying the individual values within the field. 

Postal Address Line 1 and Postal Address Line 2 are additional examples of the necessity of this analysis technique.  Not only are the cardinality of these fields very high, but they also have a very high Distinctness (i.e. the exact same field value rarely occurs on more than one record).  Some variations in postal addresses can be the results of data entry errors, the use of local conventions, or ignoring (or lacking) postal standards.

Additionally, postal address lines can sometimes contain overflow from other fields (e.g. Customer Name) or they can be used as a dumping ground for values without their own fields (e.g. Twitter username), values unable to conform to the limitations of their intended fields (e.g. countries with something analogous to a US state or CA province but incompatible with a two character field length), or comments (e.g. LDIY, which as Steve Sarsfield discovered, warns us about the Large Dog In Yard).


Postal Address Line 1

The data profiling tool has provided you the following drill-down “screen” for Postal Address Line 1:

Field Formats for Postal Address Line 1

The top twenty most frequently occurring field formats for Postal Address Line 1 collectively account for over 80% of the records with an actual value in this field for this data source.  All of these field formats appear to be common potentially valid structures.  Obviously, more than one sample field value would need to be reviewed using more drill-down analysis.

What conclusions, assumptions, and questions do you have about the Postal Address Line 1 field?


Postal Address Line 2

The data profiling tool has provided you the following drill-down “screen” for Postal Address Line 2:

Field Formats for Postal Address Line 2

The top ten most frequently occurring field formats for Postal Address Line 2 collectively account for half of the records with an actual value in this sparsely populated field for this data source.  Some of these field formats show several common potentially valid structures.  Again, more than one sample field value would need to be reviewed using more drill-down analysis.

What conclusions, assumptions, and questions do you have about the Postal Address Line 2 field?


Postal Address Validation

Many data quality initiatives include the implementation of postal address validation software.  This provides the capability to parse, identify, verify, and format a valid postal address by leveraging country-specific postal databases. 

Some examples of postal validation functionality include correcting misspelled street and city names, populating missing postal codes, and applying (within context) standard abbreviations for sub-fields such as directionals (e.g. N for North and E for East), street types (e.g. ST for Street and AVE for Avenue), and box types (e.g. BP for Boite Postale and CP for Case Postale).  These standards not only vary by country, but can also vary within a country when there are multiple official languages.

The presence of non-postal data can sometimes cause either validation failures (i.e. an inability to validate some records, not a process execution failure) or simply deletion of the unexpected values.  Therefore, some implementations will use a pre-process to extract the non-postal data prior to validation.

Most validation software will append one or more status fields indicating what happened to the records during processing.  It is a recommended best practice to perform post-validation analysis by not only looking at these status fields, but also comparing the record content before and after validation, in order to determine what modifications and enhancements have been performed.


What other analysis do you think should be performed for postal address?


In Part 6 of this series:  We will continue the adventures by analyzing the Account Number and Tax ID fields.


Related Posts

Adventures in Data Profiling (Part 1)

Adventures in Data Profiling (Part 2)

Adventures in Data Profiling (Part 3)

Adventures in Data Profiling (Part 4)

Adventures in Data Profiling (Part 6)

Adventures in Data Profiling (Part 7)

Getting Your Data Freq On

Adventures in Data Profiling (Part 4)

In Part 3 of this series:  The adventures continued with a detailed analysis of the fields Birth Date, Telephone Number and E-mail Address.  This provided you with an opportunity to become familiar with analysis techniques that use a combination of field values and field formats. 

You also saw examples of how valid values in a valid format can have an invalid context, how valid field formats can conceal invalid field values, and how free-form fields are often easier to analyze as formats constructed by parsing and classifying the individual values within the field.

In Part 4, you will continue your adventures in data profiling by going postal...postal address that is, by first analyzing the following fields: City Name, State Abbreviation, Zip Code and Country Code.


Previously, the data profiling tool provided you with the following statistical summaries for postal address:

Postal Address Summary


Country Code

Field Values for Country Code

  In Part 1, we wondered if 5 distinct Country Code field values indicated international postal addresses.  This drill-down “screen” provided by the data profiling tool shows the frequency distribution.  First of all, the field name might have lead us to assume we would only see ISO 3166 standard country codes.


However, two of the field values are a country name and not a country code.  This is another example of how verifying data matches the metadata that describes it is one essential analytical task that data profiling can help us with, providing a much needed reality check for the perceptions and assumptions that we may have about our data. 

Secondly, the field values would appear to indicate that most of the postal addresses are from the United States.  However, if you recall from Part 3, we discovered some potential clues during our analysis of Telephone Number, which included two formats that appear invalid based on North American standards, and E-mail Address, which included country code Top Level Domain (TLD) values for Canada and the United Kingdom.

Additionally, whenever a field is both 100% complete and has an extremely low cardinality, it could be an indication that the most frequently occurring value is the field's default value. 

Therefore, is it possible that US is simply the default value for Country Code for this data source?


Zip Code

Field Formats for Zip Code

  From the Part 1 comments, it was noted that Zip Code as a field name is unique to the postal code system used in the United States (US).  This drill-down “screen” provided by the data profiling tool shows the field has only a total of ten field formats.   

  The only valid field formats for ZIP (which, by the way, is an acronym for Zone Improvement Plan) are 5 digits and 9 digits when the 4 digit ZIP+4 add-on code is also present, which according to the US postal standards should be separated from the 5 digit ZIP Code using a hyphen.


The actual field formats in the Zip Code field of this data source reveal another example of how we should not make assumptions about our data based on the metadata that describes it.  Although the three most frequently occurring field formats appear to be representative of potentially valid US postal codes, the alphanumeric postal code field formats are our first indication that it is, perhaps sadly, not all about US (pun intended, my fellow Americans).

The two most frequently occurring alphanumeric field formats appear to be representative of potentially valid Canadian postal codes.  An interesting thing to note is that their combined frequency distribution is double the count of the number of records having CA as a Country Code field value.  Therefore, if these field formats are representative of a valid Canadian postal code, then some Canadian records have a contextually invalid field value in Country Code.

The other alphanumeric field formats appear to be representative of potentially valid postal codes for the United Kingdom (UK).  To the uninitiated, the postal codes of Canada (CA) and the UK appear very similar.  Both postal code formats contain two parts, which according to their postal standards should be separated by a single character space. 

In CA postal codes, the first part is called the Forward Sortation Area (FSA) and the second part is called the Local Delivery Unit (LDU).  In UK postal codes, the first part is called the outward code and the second part is called the inward code. 

One easy way to spot the difference is that a UK inward code always has the format of a digit followed by two letters (i.e. “naa” in the field formats generated by my fictional data profiling tool), whereas a CA LDU always has the format of a digit followed by a letter followed by another digit (i.e. “nan”). 

However, we should never rule out the possibility of transposed values making a CA postal code look like a UK postal code, or vice versa.  Also, never forget the common data quality challenge of valid field formats concealing invalid field values.

Returning to the most frequently occurring field format of 5 digits, can we assume all valid field values would represent US postal addresses?  Of course not.  One significant reason is that a 5 digit postal code is one of the most common formats in the world. 

Just some of the other countries also using a 5 digit postal code include: Algeria, Cuba, Egypt, Finland, France, Germany, Indonesia, Israel, Italy, Kuwait, Mexico, Spain, and Turkey.

What about the less frequently occurring field formats of 4 digits and 6 digits?  It is certainly possible that these field formats could indicate erroneous attempts at entering a valid US postal code.  However, it could also indicate the presence of additional non-US postal addresses.

Just some of the countries using a 4 digit postal code include: Australia, Austria, Belgium, Denmark, El Salvador, Georgia (no, the US state did not once again secede, there is also a country called Georgia and its not even in the Americas), Hungary, Luxembourg, Norway, and Venezuela.  Just some of the countries using a 6 digit postal code include: Belarus, China, India, Kazakhstan (yes, Borat fans, Kazakhstan is a real country), Russia, and Singapore.

Additionally, why do almost 28% of the records in this data source not have a field value for Zip Code? 

One of the possibilities is that we could have postal addresses from countries that do not have a postal code system.  Just a few examples would be: Aruba, Bahamas (sorry fellow fans of the Beach Boys, but both Jamaica and Bermuda have a postal code system, and therefore I could not take you down to Kokomo), Fiji (home of my favorite bottled water), and Ireland (home of my ancestors and inventors of my second favorite coffee).


State Abbreviation

Field Values for State Abbreviation

  From the Part 1 comments, it was noted that the cardinality of State Abbreviation appeared suspect because, if we assume that its content matches its metadata, then we would expect only 51 distinct values (i.e. actual US state abbreviations without counting US territories) and not the 72 distinct values discovered by the data profiling tool.

  Let's assume that drill-downs have revealed the single profiled field data type was CHAR, and the profiled minimum/maximum field lengths were both 2.  Therefore, State Abbreviation, when populated, always contains a two character field value.    

  This drill-down “screen” first displays the top ten most frequently occurring values in the State Abbreviation field, which are all valid US state abbreviations.  The frequency distributions are also within general expectations since eight of the largest US states by population are represented.


However, our previous analysis of Country Code and Zip Code has already made us aware that international postal addresses exist in this data source.  Therefore, this drill-down “screen” also displays the top ten most frequently occurring non-US values based on the data profiling tool comparing all 72 distinct values against a list of valid US state and territory abbreviations.

Most of the field values discovered by this analysis appear to be valid CA province codes (including PQ being used as a common alternative for QC – the province of Quebec or Québec si vous préférez).  These frequency distributions are also within general expectations since six of the largest CA provinces by population are represented.  Their combined frequency distribution is also fairly close to the combined frequency distribution of potentially valid Canadian postal codes found in the Zip Code field.

However, we still have three additional values (ZZ, SA, HD) which require more analysis.  Additionally, almost 22% of the records in this data source do not have a field value for State Abbreviation, which could be attributable to the fact that even when the postal standards for other countries include something analogous to a US state or CA province, it might not be compatible with a two character field length.


City Name

Let's assume that we have performed some preliminary analysis on the statistical summaries and frequency distributions provided by the data profiling tool for the City Name field using the techniques illustrated throughout this series so far. 

Let's also assume analyzing the City Name field in isolation didn't reveal anything suspicious.  The field is consistently populated and its frequently occurring values appeared to meet general expectations.  Therefore, let's assume we have performed additional drill-down analysis using the data profiling tool and have selected the following records of interest:

Record Drill-down for City Name

Based on reviewing these records, what conclusions, assumptions, and questions do you have about the City Name field?


What other questions can you think of for these fields?  What other analysis do you think should be performed for these fields?


In Part 5 of this series:  We will continue the adventures in data profiling by completing our initial analysis of postal address by investigating the following fields: Postal Address Line 1 and Postal Address Line 2.


Related Posts

Adventures in Data Profiling (Part 1)

Adventures in Data Profiling (Part 2)

Adventures in Data Profiling (Part 3)

Adventures in Data Profiling (Part 5)

Adventures in Data Profiling (Part 6)

Adventures in Data Profiling (Part 7)

Getting Your Data Freq On


International Man of Postal Address Standards

Since I am a geographically-challenged American, the first (and often the only necessary) option I choose for assistance with international postal address standards is Graham Rhind

His excellent book The Global Source-Book for Address Data Management is an invaluable resource and recognized standard reference that contains over 1,000 pages of data pertaining to over 240 countries and territories.