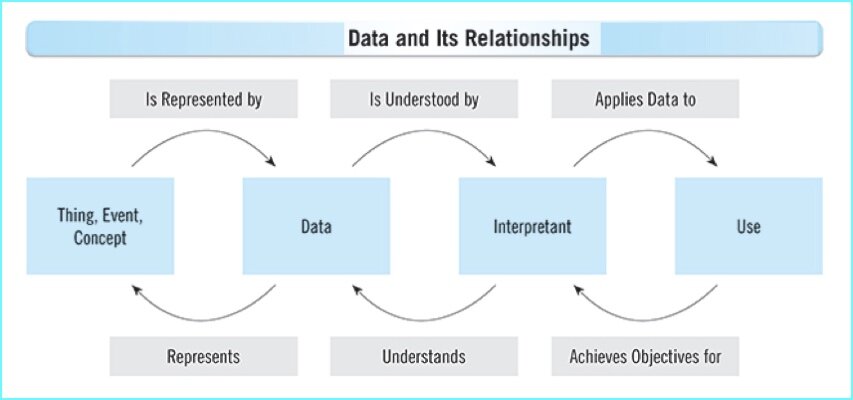
Data Silence

This blog post is sponsored by the Enterprise CIO Forum and HP.

In the era of big data, information optimization is becoming a major topic of discussion.  But when some people discuss the big potential of big data analytics under the umbrella term of data science, they make it sound like since we have access to all the data we would ever need, all we have to do is ask the Data Psychic the right question and then listen intently to the answer.

However, in his recent blog post Silence Isn’t Always Golden, Bradley S. Fordham, PhD explained that “listening to what the data does not say is often as important as listening to what it does.  There can be various types of silences in data that we must get past to take the right actions.”  Fordham described these data silences as various potential gaps in our analysis.

One data silence is syntactic gaps, which is a proportionately small amount of data in a very large data set that “will not parse (be converted from raw data into meaningful observations with semantics or meaning) in the standard way.  A common response is to ignore them under the assumption there are too few to really matter.  The problem is that oftentimes these items fail to parse for similar reasons and therefore bear relationships to each other.  So, even though it may only be .1% of the overall population, it is a coherent sub-population that could be telling us something if we took the time to fix the syntactic problems.”

This data silence reminded me of my podcast discussion with Thomas C. Redman, PhD about big data and data quality, during which we discussed how some people erroneously assume that data quality issues can be ignored in larger data sets.

Another data silence is inferential gaps, which is basing an inference on only one variable in a data set.  The example Fordham uses is from a data set showing that 41% of the cars sold during the first quarter of the year were blue, from which we might be tempted to infer that customers bought more blue cars because they preferred blue.  However, by looking at additional variables in the data set and noticing that “70% of the blue cars sold were from the previous model year, it is likely they were discounted to clear them off the lots, thereby inflating the proportion of blue cars sold.  So, maybe blue wasn’t so popular after all.”

Another data silence Fordham described using the same data set is gaps in field of view.  “At first glance, knowing everything on the window sticker of every car sold in the first quarter seems to provide a great set of data to understand what customers wanted and therefore were buying.  At least it did until we got a sinking feeling in our stomachs because we realized that this data only considers what the auto manufacturer actually built.  That field of view is too limited to answer the important customer desire and motivation questions being asked.  We need to break the silence around all the things customers wanted that were not built.”

This data silence reminded me of WYSIATI, which is an acronym coined by Daniel Kahneman to describe how the data you are looking at can greatly influence you to jump to the comforting, but false, conclusion that “what you see is all there is,” thereby preventing you from expanding your field of view to notice what data might be missing from your analysis.

As Fordham concluded, “we need to be careful to listen to all the relevant data, especially the data that is silent within our current analyses.  Applying that discipline will help avoid many costly mistakes that companies make by taking the wrong actions from data even with the best of techniques and intentions.”

Therefore, in order for your enterprise to leverage big data analytics for business success, you not only need to adopt a mindset that embraces the principles of data science, you also need to make sure that your ears are set to listen for data silence.

This blog post is sponsored by the Enterprise CIO Forum and HP.


Related Posts

Magic Elephants, Data Psychics, and Invisible Gorillas

OCDQ Radio - Data Quality and Big Data

Big Data: Structure and Quality

WYSIWYG and WYSIATI

Will Big Data be Blinded by Data Science?

Big Data el Memorioso

Information Overload Revisited

HoardaBytes and the Big Data Lebowski

The Data-Decision Symphony

OCDQ Radio - Decision Management Systems

The Big Data Theory

Finding a Needle in a Needle Stack

Darth Vader, Big Data, and Predictive Analytics

Data-Driven Intuition

A Tale of Two Datas

Open MIKE Podcast — Episode 06

Method for an Integrated Knowledge Environment (MIKE2.0) is an open source delivery framework for Enterprise Information Management, which provides a comprehensive methodology that can be applied across a number of different projects within the Information Management space.  For more information, click on this link: openmethodology.org/wiki/What_is_MIKE2.0

The Open MIKE Podcast is a video podcast show, hosted by Jim Harris, which discusses aspects of the MIKE2.0 framework, and features content contributed to MIKE 2.0 Wiki Articles, Blog Posts, and Discussion Forums.


Episode 06: Getting to Know NoSQL

If you’re having trouble viewing this video, you can watch it on Vimeo by clicking on this link: Open MIKE Podcast on Vimeo


MIKE2.0 Content Featured in or Related to this Podcast

Big Data Solution Offering: openmethodology.org/wiki/Big_Data_Solution_Offering

Preparing for NoSQL: openmethodology.org/wiki/Preparing_for_NoSQL

Hadoop and the Enterprise Debates: openmethodology.org/wiki/Hadoop_and_the_Enterprise_Debates

Big Data Definition: openmethodology.org/wiki/Big_Data_Definition

Big Sensor Data: openmethodology.org/wiki/Big_sensor_data

You can also find the videos and blog post summaries for every episode of the Open MIKE Podcast at: ocdqblog.com/MIKE


Related Posts

Data Management: The Next Generation

Is DW before BI going Bye-Bye?

Our Increasingly Data-Constructed World

Dot Collectors and Dot Connectors

HoardaBytes and the Big Data Lebowski

OCDQ Radio - Data Quality and Big Data

Exercise Better Data Management

A Tale of Two Datas

Big Data Lessons from Orbitz

The Graystone Effects of Big Data

Will Big Data be Blinded by Data Science?

Magic Elephants, Data Psychics, and Invisible Gorillas

Big Data el Memorioso

Information Overload Revisited

Finding a Needle in a Needle Stack

Darth Vader, Big Data, and Predictive Analytics

Swimming in Big Data

The Big Data Theory

Big Data: Structure and Quality

Sometimes it’s Okay to be Shallow

Availability Bias and Data Quality Improvement

The availability heuristic is a mental shortcut that occurs when people make judgments based on the ease with which examples come to mind.  Although this heuristic can be beneficial, such as when it helps us recall examples of a dangerous activity to avoid, sometimes it leads to availability bias, where we’re affected more strongly by the ease of retrieval than by the content retrieved.

In his thought-provoking book Thinking, Fast and Slow, Daniel Kahneman explained how availability bias works by recounting an experiment where different groups of college students were asked to rate a course they had taken the previous semester by listing ways to improve the course — while varying the number of improvements that different groups were required to list.

Counterintuitively, students in the group required to list more necessary improvements gave the course a higher rating, whereas students in the group required to list fewer necessary improvements gave the course a lower rating.

According to Kahneman, the extra cognitive effort expended by the students required to list more improvements biased them into believing it was difficult to list necessary improvements, leading them to conclude that the course didn’t need much improvement, and conversely, the little cognitive effort expended by the students required to list few improvements biased them into concluding, since it was so easy to list necessary improvements, that the course obviously needed improvement.

This is counterintuitive because you’d think that the students would rate the course based on an assessment of the information retrieved from their memory regardless of how easy that information was to retrieve.  It would have made more sense for the course to be rated higher for needing fewer improvements, but availability bias lead the students to the opposite conclusion.

Availability bias can also affect an organization’s discussions about the need for data quality improvement.

If you asked stakeholders to rate the organization’s data quality by listing business-impacting incidents of poor data quality, would they reach a different conclusion if you asked them to list one incident versus asking them to list at least ten incidents?

In my experience, an event where poor data quality negatively impacted the organization, such as a regulatory compliance failure, is often easily dismissed by stakeholders as an isolated incident to be corrected by a one-time data cleansing project.

But would forcing stakeholders to list ten business-impacting incidents of poor data quality make them concede that data quality improvement should be supported by an ongoing program?  Or would the extra cognitive effort bias them into concluding, since it was so difficult to list ten incidents, that the organization’s data quality doesn’t really need much improvement?

I think that the availability heuristic helps explain why most organizations easily approve reactive data cleansing projects, and availability bias helps explain why most organizations usually resist proactively initiating a data quality improvement program.


Related Posts

DQ-View: The Five Stages of Data Quality

Data Quality: Quo Vadimus?

Data Quality and Chicken Little Syndrome

The Data Quality Wager

You only get a Return from something you actually Invest in

“Some is not a number and soon is not a time”

Why isn’t our data quality worse?

Data Quality and the Bystander Effect

Data Quality and the Q Test

Perception Filters and Data Quality

Predictably Poor Data Quality

WYSIWYG and WYSIATI


Related OCDQ Radio Episodes

Clicking on the link will take you to the episode’s blog post:

  • Organizing for Data Quality — Guest Tom Redman (aka the “Data Doc”) discusses how your organization should approach data quality, including his call to action for your role in the data revolution.
  • The Johari Window of Data Quality — Guest Martin Doyle discusses helping people better understand their data and assess its business impacts, not just the negative impacts of bad data quality, but also the positive impacts of good data quality.
  • Redefining Data Quality — Guest Peter Perera discusses his proposed redefinition of data quality, as well as his perspective on the relationship of data quality to master data management and data governance.
  • Studying Data Quality — Guest Gordon Hamilton discusses the key concepts from recommended data quality books, including those which he has implemented in his career as a data quality practitioner.

Open MIKE Podcast — Episode 05

Method for an Integrated Knowledge Environment (MIKE2.0) is an open source delivery framework for Enterprise Information Management, which provides a comprehensive methodology that can be applied across a number of different projects within the Information Management space.  For more information, click on this link: openmethodology.org/wiki/What_is_MIKE2.0

The Open MIKE Podcast is a video podcast show, hosted by Jim Harris, which discusses aspects of the MIKE2.0 framework, and features content contributed to MIKE 2.0 Wiki Articles, Blog Posts, and Discussion Forums.


Episode 05: Defining Big Data

If you’re having trouble viewing this video, you can watch it on Vimeo by clicking on this link: Open MIKE Podcast on Vimeo


MIKE2.0 Content Featured in or Related to this Podcast

Big Data Definition: openmethodology.org/wiki/Big_Data_Definition

Big Sensor Data: openmethodology.org/wiki/Big_sensor_data

Hadoop and the Enterprise Debates: openmethodology.org/wiki/Hadoop_and_the_Enterprise_Debates

Preparing for NoSQL: openmethodology.org/wiki/Preparing_for_NoSQL

Big Data Solution Offering: openmethodology.org/wiki/Big_Data_Solution_Offering

You can also find the videos and blog post summaries for every episode of the Open MIKE Podcast at: ocdqblog.com/MIKE


Related Posts

Our Increasingly Data-Constructed World

Dot Collectors and Dot Connectors

HoardaBytes and the Big Data Lebowski

OCDQ Radio - Data Quality and Big Data

Exercise Better Data Management

A Tale of Two Datas

Big Data Lessons from Orbitz

The Graystone Effects of Big Data

Will Big Data be Blinded by Data Science?

Magic Elephants, Data Psychics, and Invisible Gorillas

Big Data el Memorioso

Information Overload Revisited

Finding a Needle in a Needle Stack

Darth Vader, Big Data, and Predictive Analytics

Why Can’t We Predict the Weather?

Swimming in Big Data

The Big Data Theory

Big Data: Structure and Quality

Sometimes it’s Okay to be Shallow

Small Data and VRM

A Tale of Two Datas

Is big data more than just lots and lots of data?  Is big data unstructured and not-so-big data structured?  Malcolm Chisholm explored these questions in his recent Information Management column, where he posited that there are, in fact, two datas.

“One type of data,” Chisholm explained,  “represents non-material entities in vast computerized ecosystems that humans create and manage.  The other data consists of observations of events, which may concern material or non-material entities.”

Providing an example of the first type, Chisholm explained, “my bank account is not a physical thing at all; it is essentially an agreed upon idea between myself, the bank, the legal system, and the regulatory authorities.  It only exists insofar as it is represented, and it is represented in data.  The balance in my bank account is not some estimate with a positive and negative tolerance; it is exact.  The non-material entities of the financial sector are orderly human constructs.  Because they are orderly, we can more easily manage them in computerized environments.”

The orderly human constructs that are represented in data, in the stories told by data (including the stories data tell about us and the stories we tell data) is one of my favorite topics.  In our increasingly data-constructed world, it’s important to occasionally remind ourselves that data and the real world are not the same thing, especially when data represents non-material entities since, with the possible exception of Makers using 3-D printers, data-represented entities do not re-materialize into the real world.

Describing the second type, Chisholm explained, “a measurement is usually a comparison of a characteristic using some criteria, a count of certain instances, or the comparison of two characteristics.  A measurement can generally be quantified, although sometimes it’s expressed in a qualitative manner.  I think that big data goes beyond mere measurement, to observations.”

Chisholm called the first type the Data of Representation, and the second type the Data of Observation.

The data of representation tends to be structured, in the relational sense, but doesn’t need to be (e.g., graph databases) and the data of observation tends to be unstructured, but it can also be structured (e.g., the structured observations generated by either a data profiling tool analyzing structured relational tables or flat files, or a word-counting algorithm analyzing unstructured text).

Structured and unstructured,” Chisholm concluded, “describe form, not essence, and I suggest that representation and observation describe the essences of the two datas.  I would also submit that both datas need different data management approaches.  We have a good idea what these are for the data of representation, but much less so for the data of observation.”

I agree that there are two types of data (i.e., representation and observation, not big and not-so-big) and that different data uses will require different data management approaches.  Although data modeling is still important and data quality still matters, how much data modeling and data quality is needed before data can be effectively used for specific business purposes will vary.

In order to move our discussions forward regarding “big data” and its data management and business intelligence challenges, we have to stop fiercely defending our traditional perspectives about structure and quality in order to effectively manage both the form and essence of the two datas.  We also have to stop fiercely defending our traditional perspectives about data analytics, since there will be some data use cases where depth and detailed analysis may not be necessary to provide business insight.


A Tale of Two Datas

In conclusion, and with apologies to Charles Dickens and his A Tale of Two Cities, I offer the following A Tale of Two Datas:

It was the best of times, it was the worst of times.
It was the age of Structured Data, it was the age of Unstructured Data.
It was the epoch of SQL, it was the epoch of NoSQL.
It was the season of Representation, it was the season of Observation.
It was the spring of Big Data Myth, it was the winter of Big Data Reality.
We had everything before us, we had nothing before us,
We were all going direct to hoarding data, we were all going direct the other way.
In short, the period was so far like the present period, that some of its noisiest authorities insisted on its being signaled, for Big Data or for not-so-big data, in the superlative degree of comparison only.

Related Posts

HoardaBytes and the Big Data Lebowski

The Idea of Order in Data

The Most August Imagination

Song of My Data

The Lies We Tell Data

Our Increasingly Data-Constructed World

Plato’s Data

OCDQ Radio - Demystifying Master Data Management

OCDQ Radio - Data Quality and Big Data

Big Data: Structure and Quality

Swimming in Big Data

Sometimes it’s Okay to be Shallow

Darth Vader, Big Data, and Predictive Analytics

The Big Data Theory

Finding a Needle in a Needle Stack

Exercise Better Data Management

Magic Elephants, Data Psychics, and Invisible Gorillas

Why Can’t We Predict the Weather?

Data and its Relationships with Quality

A Tale of Two Q’s

A Tale of Two G’s

Turning the M Upside Down

I am often asked about the critical success factors for enterprise initiatives, such as data quality, master data management, and data governance.

Although there is no one thing that can guarantee success, if forced to choose one critical success factor to rule them all, I would choose collaboration.

But, of course, when I say this everyone rolls their eyes at me (yes, I can see you doing it now through the computer) since it sounds like I’m avoiding the complex concepts underlying enterprise initiatives by choosing collaboration.

The importance of collaboration is a very simple concept but, as Amy Ray and Emily Saliers taught me, “the hardest to learn was the least complicated.”


The Pronoun Test

Although all organizations must define the success of enterprise initiatives in business terms (e.g., mitigated risks, reduced costs, or increased revenue), collaborative organizations understand that the most important factor for enduring business success is the willingness of people all across the enterprise to mutually pledge to each other their communication, cooperation, and trust.

These organizations pass what Robert Reich calls the Pronoun Test.  When their employees make references to the company, it’s done with the pronoun We and not They.  The latter suggests at least some amount of disengagement, and perhaps even alienation, whereas the former suggests the opposite — employees feel like part of something significant and meaningful.

An even more basic form of the Pronoun Test is whether or not people can look beyond their too often self-centered motivations and selflessly include themselves in a collaborative effort.  “It’s amazing how much can be accomplished if no one cares who gets the credit” is an old quote for which, with an appropriate irony, it is rather difficult to identify the original source.

Collaboration requires a simple, but powerful, paradigm shift that I call Turning the M Upside Down — turning Me into We.


Related Posts

The Algebra of Collaboration

The Business versus IT—Tear down this wall!

The Road of Collaboration

Dot Collectors and Dot Connectors

No Datum is an Island of Serendip

The Three Most Important Letters in Data Governance

The Stakeholder’s Dilemma

Shining a Social Light on Data Quality

Data Quality and the Bystander Effect

The Family Circus and Data Quality

The Year of the Datechnibus

Being Horizontally Vertical

The Collaborative Culture of Data Governance

Collaboration isn’t Brain Surgery

Are you Building Bridges or Digging Moats?

Open MIKE Podcast — Episode 03

Method for an Integrated Knowledge Environment (MIKE2.0) is an open source delivery framework for Enterprise Information Management, which provides a comprehensive methodology that can be applied across a number of different projects within the Information Management space.  For more information, click on this link: openmethodology.org/wiki/What_is_MIKE2.0

The Open MIKE Podcast is a video podcast show, hosted by Jim Harris, which discusses aspects of the MIKE2.0 framework, and features content contributed to MIKE 2.0 Wiki Articles, Blog Posts, and Discussion Forums.


Episode 03: Data Quality Improvement and Data Investigation

If you’re having trouble viewing this video, you can watch it on Vimeo by clicking on this link: Open MIKE Podcast on Vimeo


MIKE2.0 Content Featured in or Related to this Podcast

Enterprise Data Management: openmethodology.org/wiki/Enterprise_Data_Management_Offering_Group

Data Quality Improvement: openmethodology.org/wiki/Data_Quality_Improvement_Solution_Offering

Data Investigation: openmethodology.org/wiki/Category:Data_Investigation_and_Re-Engineering

You can also find the videos and blog post summaries for every episode of the Open MIKE Podcast at: ocdqblog.com/MIKE

Cooks, Chefs, and Data Governance

In their book Practical Wisdom, Barry Schwartz and Kenneth Sharpe quoted retired Lieutenant Colonel Leonard Wong, who is a Research Professor of Military Strategy in the Strategic Studies Institute at the United States Army War College, focusing on the human and organizational dimensions of the military.

“Innovation,” Wong explained, “develops when an officer is given a minimal number of parameters (e.g., task, condition, and standards) and the requisite time to plan and execute the training.  Giving the commanders time to create their own training develops confidence in operating within the boundaries of a higher commander’s intent without constant supervision.”

According to Wong, too many rules and requirements “remove all discretion, resulting in reactive instead of proactive thought, compliance instead of creativity, and adherence instead of audacity.”  Wong believed that it came down to a difference between cooks, those who are quite adept at carrying out a recipe, and chefs, those who can look at the ingredients available to them and create a meal.  A successful military strategy is executed by officers who are trained to be chefs, not cooks.

Data Governance’s Kitchen

Data governance requires the coordination of a complex combination of a myriad of factors, including executive sponsorship, funding, decision rights, arbitration of conflicting priorities, policy definition, policy implementation, data quality remediation, data stewardship, business process optimization, technology enablement, and, perhaps most notably, policy enforcement.

Because of this complexity, many organizations think the only way to run data governance’s kitchen is to institute a bureaucracy that dictates policies and demands compliance.  In other words, data governance policies are recipes and employees are cooks.

Although implementing data governance policies does occasionally require a cook-adept-at-carrying-out-a-recipe mindset, the long-term success of a data governance program is going to also require chefs since the dynamic challenges faced, and overcome daily, by business analysts, data stewards, technical architects, and others, exemplify today’s constantly changing business world, which can not be successfully governed by forcing employees to systematically apply rules or follow rigid procedures.

Data governance requires chefs who are empowered with an understanding of the principles of the policies, and who are trusted to figure out how to best implement the policies in a particular business context by combining rules with the organizational ingredients available to them, and creating a flexible procedure that operates within the boundaries of the policy’s principles.

But, of course, just like a military can not be staffed entirely by officers, and a kitchen can not be staffed entirely by chefs, in order to implement a data governance program successfully, an organization needs both cooks and chefs.

Similar to how data governance is neither all-top-down nor all-bottom-up, it’s also neither all-cook nor all-chef.

Only the unique corporate culture of your organization can determine how to best staff your data governance kitchen.

Open MIKE Podcast — Episode 02

Method for an Integrated Knowledge Environment (MIKE2.0) is an open source delivery framework for Enterprise Information Management, which provides a comprehensive methodology that can be applied across a number of different projects within the Information Management space.  For more information, click on this link: openmethodology.org/wiki/What_is_MIKE2.0

The Open MIKE Podcast is a video podcast show, hosted by Jim Harris, which discusses aspects of the MIKE2.0 framework, and features content contributed to MIKE 2.0 Wiki Articles, Blog Posts, and Discussion Forums.


Episode 02: Information Governance and Distributing Power

If you’re having trouble viewing this video, you can watch it on Vimeo by clicking on this link: Open MIKE Podcast on Vimeo


MIKE2.0 Content Featured in or Related to this Podcast

Information Governance: openmethodology.org/wiki/Information_Governance_Solution_Offering

Governance 2.0: openmethodology.org/wiki/Governance_2.0_Solution_Offering

You can also find the videos and blog post summaries for every episode of the Open MIKE Podcast at: ocdqblog.com/MIKE

Open MIKE Podcast — Episode 01

Method for an Integrated Knowledge Environment (MIKE2.0) is an open source delivery framework for Enterprise Information Management, which provides a comprehensive methodology that can be applied across a number of different projects within the Information Management space.  For more information, click on this link: openmethodology.org/wiki/What_is_MIKE2.0

The Open MIKE Podcast is a video podcast show, hosted by Jim Harris, which discusses aspects of the MIKE2.0 framework, and features content contributed to MIKE 2.0 Wiki Articles, Blog Posts, and Discussion Forums.


Episode 01: Information Management Principles

If you’re having trouble viewing this video, you can watch it on Vimeo by clicking on this link: Open MIKE Podcast on Vimeo


MIKE2.0 Content Featured in or Related to this Podcast

Information Management Principles: openmethodology.org/wiki/Economic_Value_of_Information

Information Economics: openmethodology.org/wiki/Information_Economics

You can also find the videos and blog post summaries for every episode of the Open MIKE Podcast at: ocdqblog.com/MIKE

Exercise Better Data Management

Recently on Twitter, Daragh O Brien and I discussed his proposed concept.  “After Big Data,” Daragh tweeted, “we will inevitably begin to see the rise of MOData as organizations seek to grab larger chunks of data and digest it.  What is MOData?  It’s MO’Data, as in MOre Data. Or Morbidly Obese Data.  Only good data quality and data governance will determine which.”

Daragh asked if MO’Data will be the Big Data Killer.  I said only if MO’Data doesn’t include MO’BusinessInsight, MO’DataQuality, and MO’DataPrivacy (i.e., more business insight, more data quality, and more data privacy).

“But MO’Data is about more than just More Data,” Daragh replied.  “It’s about avoiding Morbidly Obese Data that clogs data insight and data quality, etc.”

I responded that More Data becomes Morbidly Obese Data only if we don’t exercise better data management practices.

Agreeing with that point, Daragh replied, “Bring on MOData and the Pilates of Data Quality and Data Governance.”

To slightly paraphrase lines from one of my favorite movies — Airplane! — the Cloud is getting thicker and the Data is getting laaaaarrrrrger.  Surely I know well that growing data volumes is a serious issue — but don’t call me Shirley.

Whether you choose to measure it in terabytes, petabytes, exabytes, HoardaBytes, or how much reality bites, the truth is we were consuming way more than our recommended daily allowance of data long before the data management industry took a tip from McDonald’s and put the word “big” in front of its signature sandwich.  (Oh great . . . now I’m actually hungry for a Big Mac.)

But nowadays with silos replicating data, as well as new data, and new types of data, being created and stored on a daily basis, our data is resembling the size of Bob Parr in retirement, making it seem like not even Mr. Incredible in his prime possessed the super strength needed to manage all of our data.  Those were references to the movie The Incredibles, where Mr. Incredible was a superhero who, after retiring into civilian life under the alias of Bob Parr, elicits the observation from this superhero costume tailor: “My God, you’ve gotten fat.”  Yes, I admit not even Helen Parr (aka Elastigirl) could stretch that far for a big data joke.

A Healthier Approach to Big Data

Although Daragh’s concerns about morbidly obese data are valid, no superpowers (or other miracle exceptions) are needed to manage all of our data.  In fact, it’s precisely when we are so busy trying to manage all of our data that we hoard countless bytes of data without evaluating data usage, gathering data requirements, or planning for data archival.  It’s like we are trying to lose weight by eating more and exercising less, i.e., consuming more data and exercising less data quality and data governance.  As Daragh said, only good data quality and data governance will determine whether we get more data or morbidly obese data.

Losing weight requires a healthy approach to both diet and exercise.  A healthy approach to diet includes carefully choosing the food you consume and carefully controlling your portion size.  A healthy approach to exercise includes a commitment to exercise on a regular basis at a sufficient intensity level without going overboard by spending several hours a day, every day, at the gym.

Swimming is a great form of exercise, but swimming in big data without having a clear business objective before you jump into the pool is like telling your boss that you didn’t get any work done because you decided to spend all day working out at the gym.

Carefully choosing the data you consume and carefully controlling your data portion size is becoming increasingly important since big data is forcing us to revisit information overload.  However, the main reason that traditional data management practices often become overwhelmed by big data is because traditional data management practices are not always the right approach.

We need to acknowledge that some big data use cases differ considerably from traditional ones.  Data modeling is still important and data quality still matters, but how much data modeling and data quality is needed before big data can be effectively used for business purposes will vary.  In order to move the big data discussion forward, we have to stop fiercely defending our traditional perspectives about structure and quality.  We also have to stop fiercely defending our traditional perspectives about analytics, since there will be some big data use cases where depth and detailed analysis may not be necessary to provide business insight.

Better than Big or More

Jim Ericson explained that your data is big enough.  Rich Murnane explained that bigger isn’t better, better is better.  Although big data may indeed be followed by more data that doesn’t necessarily mean we require more data management in order to prevent more data from becoming morbidly obese data.  I think that we just need to exercise better data management.


Related Posts

Demystifying Master Data Management

OCDQ Radio is a vendor-neutral podcast about data quality and its related disciplines, produced and hosted by Jim Harris.

During this episode, special guest John Owens and I attempt to demystify master data management (MDM) by explaining the three types of data (Transaction, Domain, Master) and the four master data entities (Party, Product, Location, Asset), as well as, and perhaps the most important concept of all, the Party-Role Relationship, which is where we find many of the terms commonly used to describe the Party master data entity (e.g., Customer, Supplier, Employee).

John Owens is a thought leader, consultant, mentor, and writer in the worlds of business and data modelling, data quality, and master data management (MDM).  He has built an international reputation as a highly innovative specialist in these areas and has worked in and led multi-million dollar projects in a wide range of industries around the world.

John Owens has a gift for identifying the underlying simplicity in any enterprise, even when shrouded in complexity, and bringing it to the surface.  He is the creator of the Integrated Modelling Method (IMM), which is used by business and data analysts around the world.  Later this year, John Owens will be formally launching the IMM Academy, which will provide high quality resources, training, and mentoring for business and data analysts at all levels.

You can also follow John Owens on Twitter and connect with John Owens on Linkedin.  And if you’re looking for a MDM course, consider the online course from John Owens, which you can find by clicking on this link: MDM Online Course (Affiliate Link)

Popular OCDQ Radio Episodes

Clicking on the link will take you to the episode’s blog post:

  • Demystifying Data Science — Guest Melinda Thielbar, a Ph.D. Statistician, discusses what a data scientist does and provides a straightforward explanation of key concepts such as signal-to-noise ratio, uncertainty, and correlation.
  • Data Quality and Big Data — Guest Tom Redman (aka the “Data Doc”) discusses Data Quality and Big Data, including if data quality matters less in larger data sets, and if statistical outliers represent business insights or data quality issues.
  • Data Governance Star Wars — Special Guests Rob Karel and Gwen Thomas joined this extended, and Star Wars themed, discussion about how to balance bureaucracy and business agility during the execution of data governance programs.
  • The Johari Window of Data Quality — Guest Martin Doyle discusses helping people better understand their data and assess its business impacts, not just the negative impacts of bad data quality, but also the positive impacts of good data quality.
  • Studying Data Quality — Guest Gordon Hamilton discusses the key concepts from recommended data quality books, including those which he has implemented in his career as a data quality practitioner.