
Parmesan, Parkas, and Predictive Analytics
/This sponsored video post for the IBM for Midsize Business program leverages an infographic to examine what Italian Cheese and Arctic Work-Wear have in common.
Read MoreThis sponsored video post for the IBM for Midsize Business program leverages an infographic to examine what Italian Cheese and Arctic Work-Wear have in common.
Read MoreThis sponsored blog post for the IBM for Midsize Business program discusses the increasing need for a form of differential privacy that protects personal privacy while still enabling business insights.
Read MoreThis sponsored blog post for the IBM for Midsize Business program ponders whether the quantitative and qualitative can merge enough to be able to make sense of the messy world of sentiment analysis.
Read More
Nowadays we hear a lot of chatter, rather reminiscent of the boisterous bluster of sports talk radio debates, about the potential of big data and its related technologies to enable predictive and real-time analytics and, by leveraging an infrastructure provided by the symbiotic relationship of cloud and mobile, serve up better business performance and an enhanced customer experience.
Sports have always provided great fodder for the data-obsessed with its treasure troves of statistical data dissecting yesterday’s games down to the most minute detail, which is called upon by experts and amateurs alike to try to predict tomorrow’s games as well as analyze in real-time the play-by-play of today’s games. Arguably, it was the bestselling book Moneyball by Michael Lewis, which was also adapted into a popular movie starring Brad Pitt, that brought data obsession to the masses, further fueling the hype and overuse of sports metaphors such as how data can be a game changer for businesses in any industry and of any size.
Which is why it is so refreshing to see a tangible real-world case study for big data analytics being delivered with the force of an Andy Murray two-handed backhand as over the next two weeks the United States Tennis Association (USTA) welcomes hundreds of thousands of spectators to New York City’s Flushing Meadows for the 2013 U.S. Open tennis tournament. Both the fans in the stands and the millions more around the world will visit USOpen.org, via the web or mobile apps, in order to follow the action, watch live-streamed tennis matches, and get scores, stats, and the latest highlights and news thanks to IBM technologies.
Before, during, and after each match, predictive and real-time analytics drive IBM’s SlamTracker tool. Before matches, IBM analyzes 41 million data points collected from eight years of Grand Slam play, including head-to-head matches, similar player types, and playing surfaces. SlamTracker uses this data to create engaging and compelling tools for digital audiences, which identify key actions players must take to enhance their chances of winning, and give fans player information, match statistics, social sentiment, and more.
The infrastructure that supports the U.S. Open’s digital presence is hosted on an IBM SmartCloud. This flexible, scalable environment, managed by IBM Analytics, lets the USTA ensure continuous availability of their digital platforms throughout the tournament and year-round. The USTA and IBM give fans the ability to experience the matches from anywhere, with any device via a mobile-friendly site and engaging apps for multiple mobile platforms. Together these innovations make the U.S. Open experience immediate and intimate for fans sitting in the stands or on another continent.
In tennis, a service (also known as a serve) is a shot to start a point. In business, a service is a shot to start a point of positive customer interaction, whether that’s a point of sale or an opportunity to serve a customer’s need (e.g., resolving a complaint).
In tennis, a winner is a shot not reached by your opponent, which wins you a point. In business, a winner is a differentiator not reached by your competitor, which wins your business a sale when it makes a customer choose your product or service.
In tennis, an unforced error is a failure to complete a service or return a shot, which cannot be attributed to any factor other than poor judgement or execution by the player. In business, an unforced error is a failure to service a customer or get a return on an investment, which cannot be attributed to any factor other than poor decision making or execution by the organization.
Properly supported by enabling technologies, businesses of all sizes, and across all industries, can capture and analyze data to uncover hidden patterns and trends that can help them achieve better service, more winners, and fewer unforced errors.
Whether it’s on the court, in the stands, on the customer-facing front lines, in the dashboards used by executive management, or behind the scenes of a growing midsize business, data is a game changer. How can data change your game?

This post was written as part of the IBM for Midsize Business program, which provides midsize businesses with the tools, expertise and solutions they need to become engines of a smarter planet. I’ve been compensated to contribute to this program, but the opinions expressed in this post are my own and don’t necessarily represent IBM’s positions, strategies, or opinions.
Caffeinated Thoughts on Technology for Midsize Businesses
A Big Data Platform for Midsize Businesses
Smart Big Data Adoption for Midsize Businesses
Big Data is not just for Big Businesses
Business Analytics for Midsize Businesses
Business Intelligence for Midsize Businesses
The Graystone Effects of Big Data
Will Big Data be Blinded by Data Science?
Talking Business about the Weather
Word of Mouth has become Word of Data
The Symbiotic Relationship of Cloud and Mobile
Cloud Benefits for Midsize Businesses
Leveraging the Cloud for Application Development
Cloud Computing for Midsize Businesses
Cloud Computing is the New Nimbyism
Devising a Mobile Device Strategy
Social Business is more than Social Marketing
Social Media Marketing: From Monologues to Dialogues
OCDQ Radio is a vendor-neutral podcast about data quality and its related disciplines, produced and hosted by Jim Harris.
During this episode, special guest, and actual data scientist, Dr. Melinda Thielbar, a Ph.D. Statistician, and I attempt to demystify data science by explaining what a data scientist does, including the requisite skills involved, bridging the communication gap between data scientists and business leaders, delivering data products business users can use on their own, and providing a straightforward explanation of key concepts such as signal-to-noise ratio, uncertainty, experimentation, and correlation.
Melinda Thielbar is the Senior Mathematician for IAVO Research and Scientific. Her work there focuses on power system optimization using real-time prediction models. She has worked as a software developer, an analytic lead for big data implementations, and a statistics and programming teacher.
Melinda Thielbar is a co-founder of Research Triangle Analysts, a professional group for analysts and data scientists located in the Research Triangle of North Carolina.
While Melinda Thielbar doesn’t specialize in a single field, she is particularly interested in power systems because, as she puts it, “A power systems optimizer has to work every time.”
Clicking on the link will take you to the episode’s blog post:
Occasionally it’s necessary to temper the unchecked enthusiasm accompanying the peak of inflated expectations associated with any hype cycle. This may be especially true for big data, and especially now since, as Svetlana Sicular of Gartner recently blogged, big data is falling into the trough of disillusionment and “to minimize the depth of the fall, companies must be at a high enough level of analytical and enterprise information management maturity combined with organizational support of innovation.”
I fear the fall may feel bottomless for those who fell hard for the hype and believe the Big Data Psychic capable of making better, if not clairvoyant, predictions. When, in fact, “our predictions may be more prone to failure in the era of big data,” explained Nate Silver in his book The Signal and the Noise: Why Most Predictions Fail but Some Don't. “There isn’t any more truth in the world than there was before the Internet. Most of the data is just noise, as most of the universe is filled with empty space.”
Proposing the 3Ss (Small, Slow, Sure) as a counterpoint to the 3Vs (Volume, Velocity, Variety), Stephen Few recently blogged about the slow data movement. “Data is growing in volume, as it always has, but only a small amount of it is useful. Data is being generated and transmitted at an increasing velocity, but the race is not necessarily for the swift; slow and steady will win the information race. Data is branching out in ever-greater variety, but only a few of these new choices are sure.”
Big data requires us to revisit information overload, a term that was originally about, not the increasing amount of information, but instead the increasing access to information. As Clay Shirky stated, “It’s not information overload, it’s filter failure.”
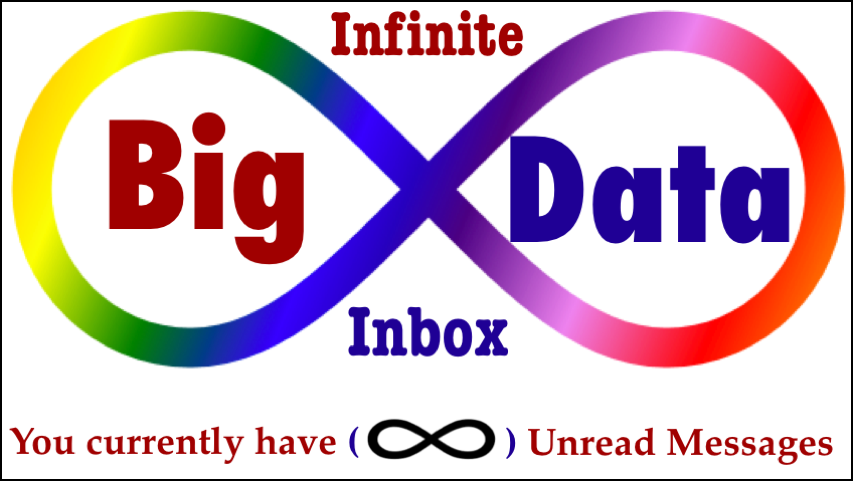
As Silver noted, the Internet (like the printing press before it) was a watershed moment in our increased access to information, but its data deluge didn’t increase the amount of truth in the world. And in today’s world, where many of us strive on a daily basis to prevent email filter failure and achieve what Merlin Mann called Inbox Zero, I find unfiltered enthusiasm about big data to be rather ironic, since big data is essentially enabling the data-driven decision making equivalent of the Infinite Inbox.
Imagine logging into your email every morning and discovering: You currently have (∞) Unread Messages.
However, I’m sure most of it probably would be spam, which you obviously wouldn’t have any trouble quickly filtering (after all, infinity minus spam must be a back of the napkin calculation), allowing you to only read the truly useful messages. Right?
I recently finished reading the TED Book by Jim Hornthal, A Haystack Full of Needles, which included an overview of the different predictive approaches taken by one of the most common forms of data-driven decision making in the era of big data, namely, the recommendation engines increasingly provided by websites, social networks, and mobile apps.
These recommendation engines primarily employ one of three techniques, choosing to base their data-driven recommendations on the “wisdom” provided by either crowds, friends, or experts.
In his book The Wisdom of Crowds, James Surowiecki explained that the four conditions characterizing wise crowds are diversity of opinion, independent thinking, decentralization, and aggregation. Amazon is a great example of a recommendation engine using this approach by assuming that a sufficiently large population of buyers is a good proxy for your purchasing decisions.
For example, Amazon tells you that people who bought James Surowiecki’s bestselling book also bought Thinking, Fast and Slow by Daniel Kahneman, Crowdsourcing: Why the Power of the Crowd Is Driving the Future of Business by Jeff Howe, and Wikinomics: How Mass Collaboration Changes Everything by Don Tapscott. However, Amazon neither provides nor possesses knowledge of why people bought all four of these books or qualification of the subject matter expertise of these readers.
However, these concerns, which we could think of as potential data quality issues, and which would be exacerbated within a small amount of transaction data where the eclectic tastes and idiosyncrasies of individual readers would not help us decide what books to buy, within a large amount of transaction data, we achieve the Wisdom of Crowds effect when, taken in aggregate, we receive a general sense of what books we might like to read based on what a diverse group of readers collectively makes popular.
As I blogged about in my post Sometimes it’s Okay to be Shallow, sometimes the aggregated, general sentiment of a large group of unknown, unqualified strangers will be sufficient to effectively make certain decisions.
Although the influence of our friends and family is the oldest form of data-driven decision making, historically this influence was delivered by word of mouth, which required you to either be there to hear those influential words when they were spoken, or have a large enough network of people you knew that would be able to eventually pass along those words to you.
But the rise of social networking services, such as Twitter and Facebook, has transformed word of mouth into word of data by transcribing our words into short bursts of social data, such as status updates, online reviews, and blog posts.
Facebook “Likes” are a great example of a recommendation engine that uses the Wisdom of Friends, where our decision to buy a book, see a movie, or listen to a song might be based on whether or not our friends like it. Of course, “friends” is used in a very loose sense in a social network, and not just on Facebook, since it combines strong connections such as actual friends and family, with weak connections such as acquaintances, friends of friends, and total strangers from the periphery of our social network.
Social influence has never ended with the people we know well, as Nicholas Christakis and James Fowler explained in their book Connected: The Surprising Power of Our Social Networks and How They Shape Our Lives. But the hyper-connected world enabled by the Internet, and further facilitated by mobile devices, has strengthened the social influence of weak connections, and these friends form a smaller crowd whose wisdom is involved in more of our decisions than we may even be aware of.
Since it’s more common to associate wisdom with expertise, Pandora is a great example of a recommendation engine that uses the Wisdom of Experts. Pandora used a team of musicologists (professional musicians and scholars with advanced degrees in music theory) to deconstruct more than 800,000 songs into 450 musical elements that make up each performance, including qualities of melody, harmony, rhythm, form, composition, and lyrics, as part of what Pandora calls the Music Genome Project.
As Pandora explains, their methodology uses precisely defined terminology, a consistent frame of reference, redundant analysis, and ongoing quality control to ensure that data integrity remains reliably high, believing that delivering a great radio experience to each and every listener requires an incredibly broad and deep understanding of music.
Essentially, experts form the smallest crowd of wisdom. Of course, experts are not always right. At the very least, experts are not right about every one of their predictions. Nor do experts always agree with other, which is why I imagine that one of the most challenging aspects of the Music Genome Project is getting music experts to consistently apply precisely the same methodology.
Pandora also acknowledges that each individual has a unique relationship with music (i.e., no one else has tastes exactly like yours), and allows you to “Thumbs Up” or “Thumbs Down” songs without affecting other users, producing more personalized results than either the popularity predicted by the Wisdom of Crowds or the similarity predicted by the Wisdom of Friends.
It’s interesting to note that the Wisdom of Experts is the only one of these approaches that relies on what data management and business intelligence professionals would consider a rigorous approach to data quality and decision quality best practices. But this is also why the Wisdom of Experts is the most time-consuming and expensive approach to data-driven decision making.
In the past, the Wisdom of Crowds and Friends was ignored in data-driven decision making for the simple reason that this potential wisdom wasn’t digitized. But now, in the era of big data, not only are crowds and friends digitized, but technological advancements combined with cost-effective options via open source (data and software) and cloud computing make these approaches quicker and cheaper than the Wisdom of Experts. And despite the potential data quality and decision quality issues, the Wisdom of Crowds and/or Friends is proving itself a viable option for more categories of data-driven decision making.
I predict that the future of wisdom will increasingly become an amalgamation of experts, friends, and crowds, with the data and techniques from all three potential sources of wisdom often acknowledged as contributors to data-driven decision making.
Sometimes it’s Okay to be Shallow
Word of Mouth has become Word of Data
The Wisdom of the Social Media Crowd
Data Management: The Next Generation
Exercise Better Data Management
Darth Vader, Big Data, and Predictive Analytics
Finding a Needle in a Needle Stack
Big Data, Predictive Analytics, and the Ideal Chronicler
The Limitations of Historical Analysis
Magic Elephants, Data Psychics, and Invisible Gorillas
OCDQ Radio - Data Quality and Big Data
Big Data: Structure and Quality
HoardaBytes and the Big Data Lebowski
This blog post is sponsored by the Enterprise CIO Forum and HP.
“Those who cannot remember the past are condemned to repeat it,” wrote George Santayana in the early 20th century to caution us about not learning the lessons of history. But with the arrival of the era of big data and dawn of the data scientist in the early 21st century, it seems like we no longer have to worry about this problem since not only is big data allowing us to digitize history, data science is also building us sophisticated statistical models from which we can analyze history in order to predict the future.
However, “every model is based on historical assumptions and perceptual biases,” Daniel Rasmus blogged. “Regardless of the sophistication of the science, we often create models that help us see what we want to see, using data selected as a good indicator of such a perception.” Although perceptual bias is a form of the data silence I previously blogged about, even absent such a bias, there are limitations to what we can predict about the future based on our analysis of the past.
“We must remember that all data is historical,” Rasmus continued. “There is no data from or about the future. Future context changes cannot be built into a model because they cannot be anticipated.” Rasmus used the example that no models of retail supply chains in 1962 could have predicted the disruption eventually caused by that year’s debut of a small retailer in Arkansas called Wal-Mart. And no models of retail supply chains in 1995 could have predicted the disruption eventually caused by that year’s debut of an online retailer called Amazon. “Not only must we remember that all data is historical,” Rasmus explained, “but we must also remember that at some point historical data becomes irrelevant when the context changes.”
As I previously blogged, despite what its name implies, predictive analytics can’t predict what’s going to happen with certainty, but it can predict some of the possible things that could happen with a certain probability. Another important distinction is that “there is a difference between being uncertain about the future and the future itself being uncertain,” Duncan Watts explained in his book Everything is Obvious (Once You Know the Answer). “The former is really just a lack of information — something we don’t know — whereas the latter implies that the information is, in principle, unknowable. The former is an orderly universe, where if we just try hard enough, if we’re just smart enough, we can predict the future. The latter is an essentially random world, where the best we can ever hope for is to express our predictions of various outcomes as probabilities.”
“When we look back to the past,” Watts explained, “we do not wish that we had predicted what the search market share for Google would be in 1999. Instead we would end up wishing we’d been able to predict on the day of Google’s IPO that within a few years its stock price would peak above $500, because then we could have invested in it and become rich. If our prediction does not somehow help to bring about larger results, then it is of little interest or value to us. We care about things that matter, yet it is precisely these larger, more significant predictions about the future that pose the greatest difficulties.”
Although we should heed Santayana’s caution and try to learn history’s lessons in order to factor into our predictions about the future what was relevant from the past, as Watts cautioned, there will be many times when “what is relevant can’t be known until later, and this fundamental relevance problem can’t be eliminated simply by having more information or a smarter algorithm.”
Although big data and data science can certainly help enterprises learn from the past in order to predict some probable futures, the future does not always resemble the past. So, remember the past, but also remember the limitations of historical analysis.
This blog post is sponsored by the Enterprise CIO Forum and HP.
Magic Elephants, Data Psychics, and Invisible Gorillas
OCDQ Radio - Data Quality and Big Data
Big Data: Structure and Quality
Will Big Data be Blinded by Data Science?
Information Overload Revisited
HoardaBytes and the Big Data Lebowski
OCDQ Radio - Decision Management Systems
Finding a Needle in a Needle Stack
This blog post is sponsored by the Enterprise CIO Forum and HP.
In the era of big data, information optimization is becoming a major topic of discussion. But when some people discuss the big potential of big data analytics under the umbrella term of data science, they make it sound like since we have access to all the data we would ever need, all we have to do is ask the Data Psychic the right question and then listen intently to the answer.
However, in his recent blog post Silence Isn’t Always Golden, Bradley S. Fordham, PhD explained that “listening to what the data does not say is often as important as listening to what it does. There can be various types of silences in data that we must get past to take the right actions.” Fordham described these data silences as various potential gaps in our analysis.
One data silence is syntactic gaps, which is a proportionately small amount of data in a very large data set that “will not parse (be converted from raw data into meaningful observations with semantics or meaning) in the standard way. A common response is to ignore them under the assumption there are too few to really matter. The problem is that oftentimes these items fail to parse for similar reasons and therefore bear relationships to each other. So, even though it may only be .1% of the overall population, it is a coherent sub-population that could be telling us something if we took the time to fix the syntactic problems.”
This data silence reminded me of my podcast discussion with Thomas C. Redman, PhD about big data and data quality, during which we discussed how some people erroneously assume that data quality issues can be ignored in larger data sets.
Another data silence is inferential gaps, which is basing an inference on only one variable in a data set. The example Fordham uses is from a data set showing that 41% of the cars sold during the first quarter of the year were blue, from which we might be tempted to infer that customers bought more blue cars because they preferred blue. However, by looking at additional variables in the data set and noticing that “70% of the blue cars sold were from the previous model year, it is likely they were discounted to clear them off the lots, thereby inflating the proportion of blue cars sold. So, maybe blue wasn’t so popular after all.”
Another data silence Fordham described using the same data set is gaps in field of view. “At first glance, knowing everything on the window sticker of every car sold in the first quarter seems to provide a great set of data to understand what customers wanted and therefore were buying. At least it did until we got a sinking feeling in our stomachs because we realized that this data only considers what the auto manufacturer actually built. That field of view is too limited to answer the important customer desire and motivation questions being asked. We need to break the silence around all the things customers wanted that were not built.”
This data silence reminded me of WYSIATI, which is an acronym coined by Daniel Kahneman to describe how the data you are looking at can greatly influence you to jump to the comforting, but false, conclusion that “what you see is all there is,” thereby preventing you from expanding your field of view to notice what data might be missing from your analysis.
As Fordham concluded, “we need to be careful to listen to all the relevant data, especially the data that is silent within our current analyses. Applying that discipline will help avoid many costly mistakes that companies make by taking the wrong actions from data even with the best of techniques and intentions.”
Therefore, in order for your enterprise to leverage big data analytics for business success, you not only need to adopt a mindset that embraces the principles of data science, you also need to make sure that your ears are set to listen for data silence.
This blog post is sponsored by the Enterprise CIO Forum and HP.
Magic Elephants, Data Psychics, and Invisible Gorillas
OCDQ Radio - Data Quality and Big Data
Big Data: Structure and Quality
Will Big Data be Blinded by Data Science?
Information Overload Revisited
HoardaBytes and the Big Data Lebowski
OCDQ Radio - Decision Management Systems
Finding a Needle in a Needle Stack
Welcome to the 400th Obsessive-Compulsive Data Quality (OCDQ) blog post! I am commemorating this milestone with the 13th entry in my ongoing series for expressing gratitude to my readers for their truly commendable comments on my blog posts.
On Will Big Data be Blinded by Data Science?, Meta Brown commented:
“Your concern is well-founded. Knowing how few businesses make really good use of the small data they’ve had around all along, it’s easy to imagine that they won’t do any better with bigger data sets.
I wrote some hints for those wallowing into the big data mire in my post, Better than Brute Force: Big Data Analytics Tips. But the truth is that many organizations won’t take advantage of the ideas that you are presenting, or my tips, especially as the datasets grow larger. That’s partly because they have no history in scientific methods, and partly because the data science movement is driving employers to search for individuals with heroically large skill sets.
Since few, if any, people truly meet these expectations, those hired will have real human limitations, and most often they will be people who know much more about data storage and manipulation than data analysis and applications.”
On Will Big Data be Blinded by Data Science?, Mike Urbonas commented:
“The comparison between scientific inquiry and business decision making is a very interesting and important one. Successfully serving a customer and boosting competitiveness and revenue does require some (hopefully unique) insights into customer needs. Where do those insights come from?
Additionally, scientists also never stop questioning and improving upon fundamental truths, which I also interpret as not accepting conventional wisdom — obviously an important trait of business managers.
I recently read commentary that gave high praise to the manager utilizing the scientific method in his or her decision-making process. The author was not a technologist, but rather none other than Peter Drucker, in writings from decades ago.
I blogged about Drucker’s commentary, data science, the scientific method vs. business decision making, and I’d value your and others’ input: Business Managers Can Learn a Lot from Data Scientists.”
On Word of Mouth has become Word of Data, Vish Agashe commented:
“I would argue that listening to not only customers but also business partners is very important (and not only in retail but in any business). I always say that, even if as an organization you are not active in the social world, assume that your customers, suppliers, employees, competitors are active in the social world and they will talk about you (as a company), your people, products, etc.
So it is extremely important to tune in to those conversations and evaluate its impact on your business. A dear friend of mine ventured into the restaurant business a few years back. He experienced a little bit of a slowdown in his business after a great start. He started surveying his customers, brought in food critiques to evaluate if the food was a problem, but he could not figure out what was going on. I accidentally stumbled upon Yelp.com and noticed that his restaurant’s rating had dropped and there were some complaints recently about services and cleanliness (nothing major though).
This happened because he had turnover in his front desk staff. He was able to address those issues and was able to reach out to customers who had bad experience (some of them were frequent visitors). They were able to go back and comment and give newer ratings to his business. This helped him with turning the corner and helped with the situation.
This was a big learning moment for me about the power of social media and the need for monitoring it.”
On Data Quality and the Bystander Effect, Jill Wanless commented:
“Our organization is starting to develop data governance processes and one of the processes we have deliberately designed is to get to the root cause of data quality issues.
We’ve designed it so that the errors that are reported also include the userid and the system where the data was generated. Errors are then filtered by function and the business steward responsible for that function is the one who is responsible for determining and addressing the root cause (which of course may require escalation to solve).
The business steward for the functional area has the most at stake in the data and is typically the most knowledgeable as to the process or system that may be triggering the error. We have yet to test this as we are currently in the process of deploying a pilot stewardship program.
However, we are very confident that it will help us uncover many of the causes of the data quality problems and with lots of PLAN, DO, CHECK, and ACT, our goal is to continuously improve so that our need for stewardship eventually (many years away no doubt) is reduced.”
On The Return of the Dumb Terminal, Prashanta Chandramohan commented:
“I can’t even imagine what it’s like to use this iPad I own now if I am out of network for an hour. Supposedly the coolest thing to own and a breakthrough innovation of this decade as some put it, it’s nothing but a dumb terminal if I do not have 3G or Wi-Fi connectivity.
Putting most of my documents, notes, to-do’s, and bookmarked blogs for reading later (e.g., Instapaper) in the cloud, I am sure to avoid duplicating data and eliminate installing redundant applications.
(Oops! I mean the apps! :) )
With cloud-based MDM and Data Quality tools starting to linger, I can’t wait to explore and utilize the advantages these return of dumb terminals bring to our enterprise information management field.”
On Big Data Lessons from Orbitz, Dylan Jones commented:
“The fact is that companies have always done predictive marketing, they’re just getting smarter at it.
I remember living as a student in a fairly downtrodden area that because of post code analytics meant I was bombarded with letterbox mail advertising crisis loans to consolidate debts and so on. When I got my first job and moved to a new area all of a sudden I was getting loans to buy a bigger car. The companies were clearly analyzing my wealth based on post code lifestyle data.
Fast forward and companies can do way more as you say.
Teresa Cottam (Global Telecoms Analyst) has cited the big telcos as a major driver in all this, they now consider themselves data companies so will start to offer more services to vendors to track our engagement across the entire communications infrastructure (Read more here: http://bit.ly/xKkuX6).
I’ve just picked up a shiny new Mac this weekend after retiring my long suffering relationship with Windows so it will be interesting to see what ads I get served!”
And please check out all of the commendable comments received on the blog post: Data Quality and Chicken Little Syndrome.
You are Awesome — which is why receiving your comments has been the most rewarding aspect of my blogging experience over the last 400 posts. Even if you have never posted a comment, you are still awesome — feel free to tell everyone I said so.
This entry in the series highlighted commendable comments on blog posts published between April 2012 and June 2012.
Since there have been so many commendable comments, please don’t be offended if one of your comments wasn’t featured.
Please continue commenting and stay tuned for future entries in the series.
Thank you for reading the Obsessive-Compulsive Data Quality blog. Your readership is deeply appreciated.
Commendable Comments (Part 12) – The Third Blogiversary of OCDQ Blog
Commendable Comments (Part 11)
Commendable Comments (Part 10) – The 300th OCDQ Blog Post
730 Days and 264 Blog Posts Later – The Second Blogiversary of OCDQ Blog
OCDQ Blog Bicentennial – The 200th OCDQ Blog Post
One of the week’s interesting technology stories was On Orbitz, Mac Users Steered to Pricier Hotels, an article by Dana Mattioli in The Wall Street Journal, about how online travel company Orbitz used data mining to discover significant spending differences between their Mac and PC customers (who were identified by the operating system of the computer used to book reservations).
Orbitz discovered that Mac users are 40% more likely to book a four- or five-star hotel, and tend to stay in more expensive rooms, spending on average $20 to $30 more a night on hotels. Based on this discovery, Orbitz has been experimenting with showing different hotel offers to Mac and PC visitors, ranking the more expensive hotels on the first page of search results for Mac users.
This Orbitz story is interesting because I think it provides two important lessons about big data for businesses of all sizes.
The first lesson is, as Mattioli reported, “the sort of targeting undertaken by Orbitz is likely to become more commonplace as online retailers scramble to identify new ways in which people’s browsing data can be used to boost online sales. Orbitz lost $37 million in 2011 and its stock has fallen by more than 74% since its 2007 IPO. The effort underscores how retailers are becoming bigger users of so-called predictive analytics, crunching reams of data to guess the future shopping habits of customers. The goal is to tailor offerings to people believed to have the highest lifetime value to the retailer.”
The second lesson is a good example of how word of mouth has become word of data. Shortly after the article was published, Orbitz became a trending topic on Twitter — but not in a way that the company would have hoped. A lot of negative sentiment was expressed by Mac users claiming that they would no longer use Orbitz since they charged Mac users more than PC users.
However, this commonly expressed misunderstanding was clarified by an Orbitz spokesperson in the article, who explained that Orbitz is not charging Mac users more money for the same hotels, but instead they are simply setting the default search rank to show Mac users the more expensive hotels first. Mac users can always re-sort the results ascending by price in order to see the same less expensive hotels that would be displayed in the default search rank used for PC users. Orbitz is attempting to offer a customized (albeit a generalized, not personalized) user experience, but some users see it as gaming the system against them.
This Orbitz story provides two lessons about the brave new business world brought to us by big data and data science, where more companies are using predictive analytics to discover business insights, and more customers are empowering themselves with data.
Business has always resembled a battlefield. But nowadays, data is the weapon of choice for companies and customers alike, since, in our increasing data-constructed world, big data is no longer just for big companies, and everyone is a data geek now.

This post was written as part of the IBM for Midsize Business program, which provides midsize businesses with the tools, expertise and solutions they need to become engines of a smarter planet.
As a big data geek and a big fan of science fiction, I was intrigued by Zoe Graystone, the central character of the science fiction television show Caprica, which was a spin-off prequel of the re-imagined Battlestar Galactica television show.
Zoe Graystone was a teenage computer programming genius who created a virtual reality avatar of herself based on all of the available data about her own life, leveraging roughly 100 terabytes of personal data from numerous databases. This allowed her avatar to access data from her medical files, DNA profiles, genetic typing, CAT scans, synaptic records, psychological evaluations, school records, emails, text messages, phone calls, audio and video recordings, security camera footage, talent shows, sports, restaurant bills, shopping receipts, online search history, music lists, movie tickets, and television shows. The avatar transformed that big data into personality and memory, and believably mimicked the real Zoe Graystone within a virtual reality environment.
The best science fiction reveals just how thin the line is that separates imagination from reality. Over thirty years ago, around the time of the original Battlestar Galactica television show, virtual reality avatars based on massive amounts of personal data would likely have been dismissed as pure fantasy. But nowadays, during the era of big data and data science, the idea of Zoe Graystone creating a virtual reality avatar of herself doesn’t sound so far-fetched, nor is it pure data science fiction.
“On Facebook,” Ellis Hamburger recently blogged, “you’re the sum of all your interactions and photos with others. Foursquare began its life as a way to see what your friends are up to, but it has quickly evolved into a life-logging tool / artificial intelligence that knows you like an old friend does.”
Facebook and Foursquare are just two social media examples of our increasingly data-constructed world, which is creating a virtual reality environment where our data has become our avatar and our digital mouths are speaking volumes about us.
Big data and real data science are enabling people and businesses of all sizes to put this virtual reality environment to good use, such as customers empowering themselves with data and companies using predictive analytics to discover business insights.
I refer to the positive aspects of Big Data as the Zoe Graystone Effect.
But there are also negative aspects to the virtual reality created by our big data avatars. For example, in his recent blog post Rethinking Privacy in an Era of Big Data, Quentin Hardy explained “by triangulating different sets of data (you are suddenly asking lots of people on LinkedIn for endorsements on you as a worker, and on Foursquare you seem to be checking in at midday near a competitor’s location), people can now conclude things about you (you’re probably interviewing for a job there).”
On the Caprica television show, Daniel Graystone (her father) used Zoe’s avatar as the basis for an operating system for a race of sentient machines known as Cylons, which ultimately lead to the Cylon Wars and the destruction of most of humanity. A far less dramatic example from the real world, which I explained in my blog post The Data Cold War, is how companies like Google use the virtual reality created by our big data avatars against us by selling our personal data (albeit indirectly) to advertisers.
I refer to the negative aspects of Big Data as the Daniel Graystone Effect.
How have your personal life and your business activities been affected by the Graystone Effects of Big Data?

This post was written as part of the IBM for Midsize Business program, which provides midsize businesses with the tools, expertise and solutions they need to become engines of a smarter planet.
Businesses of all sizes are always looking for ways to increase revenue, decrease costs, and operate more efficiently. When I talk with midsize business owners, I hear the typical questions. Should we hire a developer to update our website and improve our SEO rankings? Should we invest less money in traditional advertising and invest more time in social media? After discussing these and other business topics for a while, we drift into that standard conversational filler — talking about the weather.
But since I am always interested in analyzing data from as many different perspectives as possible, when I talk about the weather, I ask midsize business owners how much of a variable the weather plays in their business. Does the weather affect the number of customers that visit your business on a daily basis? Do customers purchase different items when the weather is good versus bad?
I usually receive quick responses, but when I ask if those responses were based on analyzing sales data alongside weather data, the answer is usually no, which is understandable since businesses are successful when they can focus on their core competencies, and for most businesses, analytics is not a core competency. The demands of daily operations often prevent midsize businesses from stepping back and looking at things differently, like whether or not there’s a hidden connection between weather and sales.
One of my favorite books is Freakonomics: A Rogue Economist Explores the Hidden Side of Everything by Steven Levitt and Stephen Dubner. The book, as well as its sequel, podcast, and movie, provides good examples of one of the common challenges facing data science, and more specifically predictive analytics since its predictions often seem counterintuitive to business leaders, whose intuition is rightfully based on their business expertise, which has guided their business success to date. The reality is that even organizations that pride themselves on being data driven naturally resist any counterintuitive insights found in their data.
Dubner was recently interviewed by Crysta Anderson about how organizations can find insights in their data if they are willing and able to ask good questions. Of course, it’s not always easy to determine what a good question would be. But sometimes something as simple as talking about the weather when you’re talking business could lead to a meaningful business insight.
This post was written as part of the IBM for Midsize Business program, which provides midsize businesses with the tools, expertise and solutions they need to become engines of a smarter planet.
All of the hype about Big Data is also causing quite the hullabaloo about hiring Data Scientists in order to help your organization derive business value from big data analytics. But even though we are still in the hype and hullabaloo stages, these unrelenting trends are starting to rightfully draw the attention of businesses of all sizes. After all, the key word in big data isn’t big, because, in our increasing data-constructed world, big data is no longer just for big companies and high-tech firms.
And since the key word in data scientist isn’t data, in this post I want to focus on the second word in today’s hottest job title.
When I think of a scientist of any kind, I immediately think of the scientific method, which has been the standard operating procedure of scientific discovery since the 17th century. First, you define a question, gather some initial data, and form a hypothesis, which is some idea about how to answer your question. Next, you perform an experiment to test the hypothesis, during which more data is collected. Then, you analyze the experimental data and evaluate your results. Whether or not the experiment confirmed or contradicted your hypothesis, you do the same thing — repeat the experiment. Because a hypothesis can only be promoted to a theory after repeated experimentation (including by others) consistently produces the same result.
During experimentation, failure happens just as often as, if not more often than, success. However, both failure and success have long played an important role in scientific discovery because progress in either direction is still progress.
Therefore, experimentation is an essential component of scientific discovery — and data science is certainly no exception.
“Designed experiments,” Melinda Thielbar recently blogged, “is where we’ll make our next big leap for data science.” I agree, but with the notable exception of A/B testing in marketing, most business activities generally don’t embrace data experimentation.
“The purpose of science,” Tom Redman recently explained, “is to discover fundamental truths about the universe. But we don’t run our businesses to discover fundamental truths. We run our businesses to serve a customer, gain marketplace advantage, or make money.” In other words, the commercial application of science has more to do with commerce than it does with science.
One example of the challenges inherent in the commercial application of science is the misconception that predictive analytics can predict what is going to happen with certainty. When instead, what it actually does is predict some of the possible things that could happen with a certain probability. Although predictive analytics can be a valuable tool for many business activities, especially decision making, as Steve Miller recently blogged, most of us are not good at using probabilities to make decisions.
So, with apologies to Thomas Dolby, I can’t help but wonder, will big data be blinded by data science? Will the business leaders being told to hire data scientists to derive business value from big data analytics be blind to what data science tries to show them?

This post was written as part of the IBM for Midsize Business program, which provides midsize businesses with the tools, expertise and solutions they need to become engines of a smarter planet.
OCDQ Radio is a vendor-neutral podcast about data quality and its related disciplines, produced and hosted by Jim Harris.
This is Part 2 of 2 from my recent discussion with Tom Redman. In this episode, Tom and I discuss data quality and big data, including if data quality matters less in larger data sets, if statistical outliers represent business insights or data quality issues, statistical sampling errors versus measurement calibration errors, mistaking signal for noise (i.e., good data for bad data), and whether or not the principles and practices of true “data scientists” will truly be embraced by an organization’s business leaders.
Dr. Thomas C. Redman (the “Data Doc”) is an innovator, advisor, and teacher. He was first to extend quality principles to data and information in the late 80s. Since then he has crystallized a body of tools, techniques, roadmaps and organizational insights that help organizations make order-of-magnitude improvements.
More recently Tom has developed keen insights into the nature of data and formulated the first comprehensive approach to “putting data to work.” Taken together, these enable organizations to treat data as assets of virtually unlimited potential.
Tom has personally helped dozens of leaders and organizations better understand data and data quality and start their data programs. He is a sought-after lecturer and the author of dozens of papers and four books. The most recent, Data Driven: Profiting from Your Most Important Business Asset (Harvard Business Press, 2008) was a Library Journal best buy of 2008.
Prior to forming Navesink Consulting Group in 1996, Tom conceived the Data Quality Lab at AT&T Bell Laboratories in 1987 and led it until 1995. Tom holds a Ph.D. in statistics from Florida State University. He holds two patents.
Clicking on the link will take you to the episode’s blog post:
Obsessive-Compulsive Data Quality (OCDQ) is a blog offering a vendor-neutral perspective on data quality and its related disciplines.
| Home | Blog | Podcast | Videos | Best of OCDQ | Published Articles | About | Contact |
|
© 2022, Jim Harris. |
Powered by Squarespace |

